Economics Homework Key: Price Elasticity of Demand
advertisement
Chapter 4 Homework question KEY
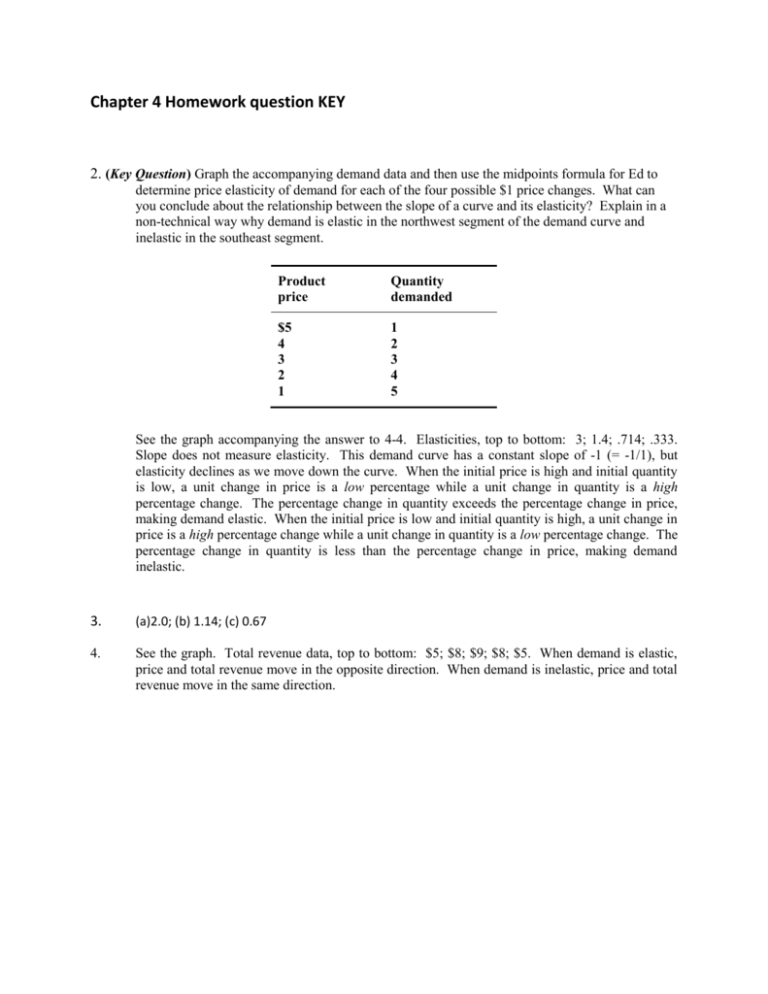
2. (Key Question) Graph the accompanying demand data and then use the midpoints formula for Ed to
determine price elasticity of demand for each of the four possible $1 price changes. What can
you conclude about the relationship between the slope of a curve and its elasticity? Explain in a
non-technical way why demand is elastic in the northwest segment of the demand curve and
inelastic in the southeast segment.
Product
price
Quantity
demanded
$5
4
3
2
1
1
2
3
4
5
See the graph accompanying the answer to 4-4. Elasticities, top to bottom: 3; 1.4; .714; .333.
Slope does not measure elasticity. This demand curve has a constant slope of -1 (= -1/1), but
elasticity declines as we move down the curve. When the initial price is high and initial quantity
is low, a unit change in price is a low percentage while a unit change in quantity is a high
percentage change. The percentage change in quantity exceeds the percentage change in price,
making demand elastic. When the initial price is low and initial quantity is high, a unit change in
price is a high percentage change while a unit change in quantity is a low percentage change. The
percentage change in quantity is less than the percentage change in price, making demand
inelastic.
3.
(a)2.0; (b) 1.14; (c) 0.67
4.
See the graph. Total revenue data, top to bottom: $5; $8; $9; $8; $5. When demand is elastic,
price and total revenue move in the opposite direction. When demand is inelastic, price and total
revenue move in the same direction.
Question 4-4
5.
Total revenue would increase in (c), (d), (e), and (f); decrease in (a) and (b); and remain the same
in (g).
8.
Substitutability, proportion of income; luxury versus necessity, and time. Elastic: (a), (c), (e).
Inelastic: (b), (d), and (f).
9.
The ruling would make the price elasticity of demand more inelastic than if there were no such
rule, assuming that there is not another equivalent university nearby to which students could
transfer. Although universities are non-profit organizations, the rule would certainly allow them
to raise rates without worrying so much about students moving out to live elsewhere.
Using the midpoint formula, Es = 1.91 {= (200/[(1000+1200)/2] / 2/[(20+22)/2]}
Supply is price elastic (Es>1).
A and B are substitutes; C and D are complements.
11.
14.
16.
All are normal goods—income and quantity demanded move in the same direction. These
coefficients reveal that a 1 percent increase in income will increase the quantity of movies
demanded by 3.4 percent, of dental services by 1.0 percent, and of clothing by 0.5 percent. A
negative coefficient indicates an inferior good—income and quantity demanded move in the
opposite direction.
18.
The incidence of a tax is likely to be primarily on consumers when demand is highly inelastic and
primarily on producers when demand is elastic. The more elastic the supply, the greater the
incidence of an excise tax on consumers and less on producers.


