6.2 Normal distribution Standard Normal Distribution:
advertisement

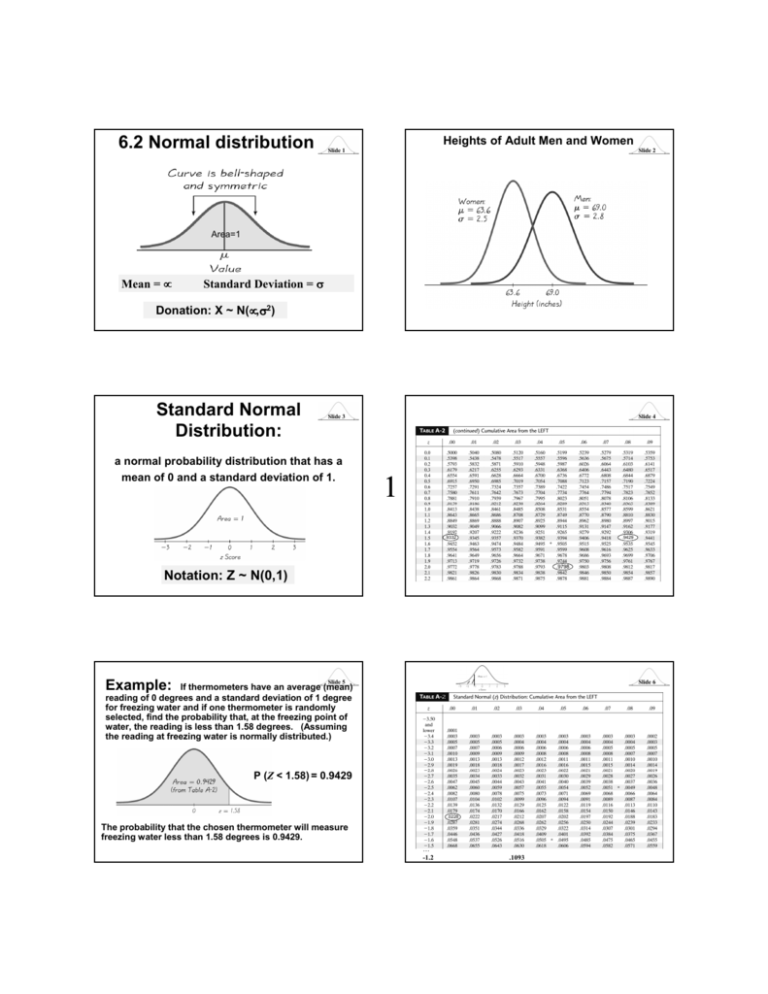
6.2 Normal distribution Heights of Adult Men and Women Slide 1 Slide 2 Slide 3 Slide 4 Area=1 Mean = µ Standard Deviation = σ Donation: X ~ N(µ µ,σ σ2) Standard Normal Distribution: a normal probability distribution that has a mean of 0 and a standard deviation of 1. 1 .9332 .9429 .9798 Notation: Z ~ N(0,1) Example: Slide 5 Slide 6 If thermometers have an average (mean) reading of 0 degrees and a standard deviation of 1 degree for freezing water and if one thermometer is randomly selected, find the probability that, at the freezing point of water, the reading is less than 1.58 degrees. (Assuming the reading at freezing water is normally distributed.) 1 P (Z < 1.58) = 0.9429 .0228 The probability that the chosen thermometer will measure freezing water less than 1.58 degrees is 0.9429. … -1.2 .1093 Slide 7 Slide 8 Example: Example: If thermometers have an average (mean) reading of 0 degrees and a standard deviation of 1 degree for freezing water, and if one thermometer is randomly selected, find the probability that it reads (at the freezing point of water) above –1.23 degrees. A thermometer is randomly selected. Find the probability that it reads (at the freezing point of water) between –2.00 and 1.50 degrees. (1) P (Z < –2.00) = 0.0228 (2) P (Z < 1.50) = 0.9332 (3) P (–2.00 < Z < 1.50) = 0.9332 – 0.0228 = 0.9104 1 P (z > –1.23) = 0.8907 The probability that the chosen thermometer with a reading above –1.23 degrees is 0.8907. Inverse problem: Finding z Scores when Given Probabilities 1.645 2 Finding the Bottom 2.5% and Upper 2.5% Slide 11 (One z score will be negative and the other positive) Finding the Bottom 2.5% and Upper 2.5% Slide 10 (One z score will be negative and the other positive) Finding the 95th Percentile =1.645 Finding z Scores when Given Probabilities Finding z Scores when Given Probabilities Slide 9 5% or 0.05 (z score will be positive) The probability that the chosen thermometer has a reading between – 2.00 and 1.50 degrees is 0.9104. If many thermometers are selected and tested at the freezing point of water, then 91.04% of them will read between –2.00 and 1.50 degrees. Finding z Scores when Given Probabilities Slide 12 (One z score will be negative and the other positive) Thus, the bottom 2.5% values are less than –1.96 and the upper 2.5% values are bigger than 1.96. Example: What IQ Do You Need to Get Into Mensa? Example: What IQ Do You Need to Get Into Mensa? Slide 13 Slide 14 • How many standard deviations above the mean is the 98th percentile? • Mensa is a society of high-IQ people whose members have a score on an IQ test at the 98th percentile or higher. – The cumulative probability of 0.980 in the body of Table A corresponds to z = 2.05 (inside out method). – The 98th percentile is 2.05 standard deviations above µ. Example: What IQ Do You Need to Get Into Mensa? Z-Score for a Value of a Random Variable Slide 15 • What is the IQ for that percentile? – Since µ = 100 and = 16, the 98th percentile of IQ equals: σ µ + 2.05 = 100 + 2.05(16) = 133 σ 3 • The z-score for a value of a random variable is the number of standard deviations that x falls from the mean µ. • It is calculated as: z = Example: Finding Your Relative Standing on The SAT Slide 17 • Scores on the verbal or math portion of the SAT are approximately normally distributed with mean µ = 500 and standard deviation = 100. The scores range from 200 to 800. Slide 16 x - µ σ Example: Finding Your Relative Standing on The SAT • If one of your SAT scores was x = 650, how many standard deviations from the mean was it? σ z= x-µ σ = 650 - 500 = 1.50 100 Slide 18 Example: Finding Your Relative Standing on The SAT Example: What Proportion of Students Get A Grade of B? Slide 19 • On the midterm exam in introductory statistics, an instructor always give a grade of B to students who score between 80 and 90. • One year, the scores on the exam have approximately a normal distribution with mean 83 and standard deviation 5. • About what proportion of students get a B? • What percentage of SAT scores was higher than yours? – Find the cumulative probability for the z-score of 1.50 from Table A. – The cumulative probability is 0.9332. – The probability above 650 is 1 – 0.9332 = 0.0668 – About 6.7% of SAT scores are higher than yours. Example: What Proportion of Students Get A Grade of B? Example: What Proportion of Students Get A Grade of B? Slide 21 • Calculate the z-score for 80 and for 90: z= z= x-µ σ x-µ σ = 90 - 83 = 1.40 5 = 80 - 83 = - 0.60 5 Using z-scores to Find Normal Probabilities • If we’re given a value x and need to find a probability, convert x to a z-score using: z = x - µ σ • Use a table of normal probabilities to get a cumulative probability. • Convert it to the probability of interest. 4 Slide 23 Slide 20 Slide 22 • Look up the cumulative probabilities in Table A. – For z = 1.40, cum. Prob. = 0.9192 – For z = -0.60, cum. Prob. = 0.2743 • It follows that about 0.9192 – 0.2743 = 0.6449, or about 64% of the exam scores were in the ‘B’ range. Using z-scores to Find Random Variable x Values Slide 24 • If we’re given a probability and need to find the value of x, convert the probability to the related cumulative probability. • Find the z-score using a normal table. • Evaluate x = z + µ. σ What is the z-score for your SAT score of 650? Example: How Can We Compare Test Slide 25 Scores That Use Different Scales? For the SAT scores: µ = 500 and a. 2.15 b. 1.50 c. -1.75 d. -1.25 • When you applied to college, you scored 650 on an SAT exam, which had mean µ = 500 and standard deviation = 100. • Your friend took the comparable ACT in 2001, scoring 30. That year, the ACT had µ = 21.0 and = 4.7. • How can we tell who did better? σ Slide 26 = 100. σ σ What percentage of students scored higher than you? a. b. c. d. 10% 5% 2% 7% What percentage of students scored higher than your friend? a. b. c. d. 3% 6% 10% 1% What is the z-score for your friend’s ACT score of 30? Slide 27 5 Slide 29 Slide 28 The ACT scores had a mean of 21 and a standard deviation of 4.7. a. 1.84 b. -1.56 c. 1.91 d. -2.24 Standard Normal Distribution • The standard normal distribution is the normal distribution with mean µ = 0 and standard deviation = 1. • It is the distribution of normal z-scores. σ Slide 30


