Appendix IV - One Story Productions
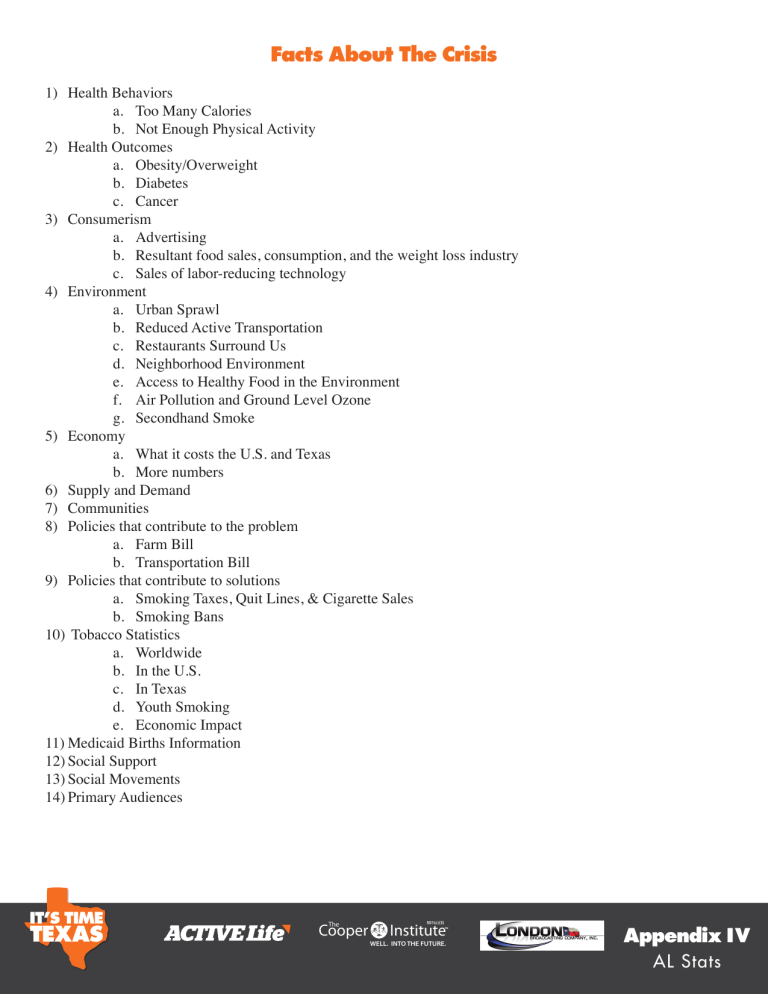
Facts About The Crisis
1)
2)
3)
4)
5)
6)
7)
8)
Health Behaviors a. b. a. b.
Too Many Calories
Not Enough Physical Activity
Health Outcomes
Obesity/Overweight
Diabetes c. Cancer
Consumerism a. b.
Advertising
Resultant food sales, consumption, and the weight loss industry c. Sales of labor-reducing technology
Environment e. f. g.
Economy a. b. c. d.
Urban Sprawl
Reduced Active Transportation
Restaurants Surround Us
Neighborhood Environment
Access to Healthy Food in the Environment
Air Pollution and Ground Level Ozone
Secondhand Smoke a. b.
What it costs the U.S. and Texas
More numbers
Supply and Demand
Communities
Policies that contribute to the problem a. b.
Farm Bill
9)
Transportation Bill
Policies that contribute to solutions a. b.
Smoking Taxes, Quit Lines, & Cigarette Sales
Smoking Bans
10) Tobacco Statistics
11)
12)
13)
14) a. b. c. d. e.
Worldwide
In the U.S.
In Texas
Youth Smoking
Economic Impact
Medicaid Births Information
Social Support
Social Movements
Primary Audiences
IT’S TIME
TEXAS 501(c)(3) Cooper Institute
WELL. INTO THE FUTURE.
TM Appendix IV
AL Stats
1) Health Behaviors a. Too Many Calories
•
•
25% of U.S. adults eat fast food every day.
1
1/3 of the average American’s calories come from junk food.
2
• Almost 80% of children and adolescents reported eating less than five fruits or vegetables daily in 2007 when fried potatoes and potato chips were excluded.
3
• Of children ages 2-17, 61% do not meet the USDA’s dietary recommendation for fiber.
4 b. Lack of Physical Activity
•
•
•
Nearly 65% of American youth do not meet current physical activity guidelines on a regular basis.
5
Average U.S. adults spend 335 hours/yr-or 42 8-hour workdays-behind the wheel 6
In 2005, 23.7% of American adults reported no leisure time physical activity.
7
2) Health Outcomes: What happens to our bodies?
a. Obesity/Overweight
•
•
The average American today is 23 pounds overweight.
8
32% of U.S. children are obese or overweight 9
•
•
3.8 million Americans weigh over 300 pounds.
10
Today’s children are the first generation since the times of infectious disease epidemics whose life expectancy may be lower than that of their parents.
11 b. Diabetes and Hypertension
• 20 million Americans have Type II diabetes; 176,500 are under the age of twenty.
10
•
•
•
54 million more Americans are pre-diabetic; 2 million are under the age of twenty.
12
29% of all American adults have hypertension; 28% have pre-hypertension.
13
Children are given medicine for hypertension rather advice to change their habits.
14
IT’S TIME
TEXAS 501(c)(3) Cooper Institute
WELL. INTO THE FUTURE.
TM Appendix IV
AL Stats
c. Cancer, Overweight/Obesity, Diet and Physical Inactivity
• Each year 550,000 Americans die of cancer; fully 1/3 of these deaths are linked to poor diet, physical inactivity, and excess weight.
15
• Cancers worsened by excess body weight include: uterus, kidney, esophagus, gallbladder, colon and rectum, and breast (in postmenopausal women), liver, pancreas, prostate, cervix, ovary, stomach (in men), non-Hodgkin lymphoma, and multiple myeloma.
16
3) Consumerism: What are we buying?
a. Advertising
•
•
$13.4 billion was spent on advertising for food, beverages and candy together with restaurants placing it third on the list, after retail and automotive advertising expenditures.
17
A link between seeing television junk food ads and overweight prevalence has been established.
18 The average child sees 2000-4000 television junk food ads/year (15 per day).
19 Of these ads, 98% promote products high in fat, sugar, and/or sodium 20 b. Resultant food sales, consumption, and the weight loss industry
•
•
Fast-food sales have increased over 1000% since 1975, from $16.1 billion to $190.8 billion in 2009.
21
As a country, we spend over half of every food dollar on ready-prepared, ready-to-eat food—most of which is high in added fats and sugars.
22
• Processed grocery foods, frozen foods, and baked goods represented over 40% of supermarket sales in
2000, while produce claimed only 9%.
23 c. Sales of labor-reducing technology
•
•
In 1978, only 8% of American households had microwaves; by 1999, 83% did.
24
Computer and video games sales tripled from $3.7 billion in 1996 to $10.7 in 2009.
25
4) Environment: What’s going on around us?
a. Urban Sprawl
• Suburban sprawl = heavier residents: Residents in the most sprawling counties on average weigh 6.3 pounds more than those living in the most compact counties.
26
IT’S TIME
TEXAS 501(c)(3) Cooper Institute
WELL. INTO THE FUTURE.
TM Appendix IV
AL Stats
b. Reduced Active Transportation
• 90% of all trips made by Americans are by car; 25% of all trips are less than a mile, and 75% of trips
•
• shorter than a mile are made in a car.
27
Each additional kilometer walked per day is associated with a 4% reduction in the odds of being obese.
28
Improve walkability to increase physical activity: A 5% increase in neighborhood walkability is associated with a 32.1% increase in minutes of active transportation.
29 c. Restaurants
• The increase in per capita number of restaurants since 1978 makes the largest contribution to trends in weight outcomes, accounting for 69% of the growth in BMI and 68% of the rise in the percentage of people who are obese.
30 d. Neighborhood Environment
• Residents in neighborhoods with boarded-up stores and homes, litter and graffiti are seven times more likely to die prematurely than those living in safe and clean neighborhoods.
31 d. Access to Healthy Food in the Neighborhood
• The presence of convenience stores in neighborhoods is associated with a higher prevalence of obesity
• and overweight, whereas the presence of supermarkets is associated with a lower prevalence of obesity and overweight.
32
There are 4 times more supermarkets in predominantly white neighborhoods than in predominantly
•
•
•
•
African-American neighborhoods, and larger numbers of supermarkets in wealthier neighborhoods.
33
Low-income neighborhoods have only 75% as many chain supermarkets as middle-income areas.
34
Predominantly African-American neighborhoods have only 50% as many chain supermarkets as middleincome areas.
35
Predominantly Hispanic neighborhoods have only 32% as many chain supermarkets as predominantly white areas.
36
Residents of poor neighborhoods must travel more than two miles to access the same number of supermarkets as are available within a half-mile to residents of non-poor areas.
37
IT’S TIME
TEXAS 501(c)(3) Cooper Institute
WELL. INTO THE FUTURE.
TM Appendix IV
AL Stats
e. Air pollution and ground level ozone
• In 2007, 158.5 million people lived in counties that exceeded national ambient air quality standards.
38
• Health effects of unhealthy ozone levels include airway irritation, coughing, pain when breathing, breathing difficulties during exercise or outdoor activities, inflammation, aggravation of asthma, and permanent lung damage.
39 f. Second-hand smoke
• The California Environmental Protection Agency estimates that secondhand smoke exposure causes approximately 3,400 lung cancer deaths and 22,700–69,600 heart disease deaths annually among adult nonsmokers in the United States.
40
•
•
Parents are responsible for 90% of children’s exposure to secondhand smoke.
41
The level of secondhand smoke a child is exposed to is directly proportional to the likelihood of the child becoming a smoker as an adolescent or an adult.
42
5) Economy: What is it all costing us?
a. What it Costs the U.S. and Texas
•
•
•
•
$117 billion-US-Total direct and indirect costs of the obesity epidemic in 2001.
43
$76 billion-US-Physical inactivity-related medical expenses.
44
25% of the nation’s healthcare costs-the two above-mentioned expenses.
45
$174 billion-US-Annual economic impact of diabetes.
46
• $73.4 billion- US-Estimated total cost of hypertension for 2009.
47
What do those costs mean?
• The total cost of obesity and its related diseases total over $440 billion… that’s almost as much as the entire country spends on public elementary and secondary education, which is $449 billion.
48 b. More Numbers
• $45 billion- US-Annual cost of obese employees to private employers in medical expenses and
• excessive absenteeism.
49
$39 billion- TX-2040 projection for overweight and obesity-related costs, if current trends continue.
50
IT’S TIME
TEXAS 501(c)(3) Cooper Institute
WELL. INTO THE FUTURE.
TM Appendix IV
AL Stats
6) Supply and Demand: What is there too much of and not enough of?
• Lack of demand for physical activity at both home and work is responsible for the other 60% of
• population level weight gain.
51
Lack of supply of nutrition education: o
While food manufacturers spent $7 billion on advertising in 1997, the U.S.D.A. spent less
• than one twentieth of that, only $333.3 million, on nutrition education, evaluation, and demonstrations.
52
7) Community: What is happening in our communities?
• Community factors influence behavioral adherence to physical activity guidelines: social cognitive, personal, environmental, or SES factors may be more influential than the guidelines themselves.
53
Schools: Peer effects on adolescent overweight showed that friends’ weight correlated with adolescents’ own weight, especially for females and adolescents with high body mass indexes.
54
8) Policy: What has allowed this to happen?
a. Farm Bill
• U.S. Farm Policy helps to make unhealthy diets an economically sensible choice.
55
• For the past 50 years, U. S. farm policy (The Farm Bill) has been increasingly directed toward driving down the price of a few farm commodities, including corn and soybeans, that are highly profitable for food industry companies who process food with high-fructose corn syrup and hydrogenated oils.
56
• From 1985-2000, the real price of fresh fruits and vegetables went up almost 40% in the United States, while the real price of fats and sugars declined, and the price of meat products has remained relatively stable.
57 b. Transportation Bill
• 80% of the $300 billion transportation bill funds new roads and highways, leaving only 20% for public transit, bicycle paths, and sidewalks—this keeps more Americans in their cars.
58
IT’S TIME
TEXAS 501(c)(3) Cooper Institute
WELL. INTO THE FUTURE.
TM Appendix IV
AL Stats
• The National Resources Defense Council recommends that Congress should: provide adequate funding for programs that facilitate active lifestyles, such as Transportation Enhancements and Safe Routes to Schools program; support active communities by placing public transit, biking and walking on an equal footing with highway construction in the funding mix; require that state and local transportation planning address public health threats such as obesity.
59
9) Policies that have positively impacted population-level health a. Smoking taxes, quit lines, & cigarette sales
•
•
There has been a 321% increase in federal excise tax and a 267% increase in average state excise tax since 1995.
60
In Texas and Iowa, which each increased their cigarette taxes by $1.00 in 2007, the number of calls to the state quit lines have been much higher compared to the previous year.
61 b. Smoking bans
• 18 months after a smoking ban was enacted in Pueblo, CO, hospital admissions for heart attacks dropped by 27%, while neighboring towns without bans showed no change--the decline in heart attacks was attributed to the smoking ban, which reduced exposure to secondhand smoke.
62
• A 1992 document from Phillip Morris summarized the tobacco industry’s concern about the effects of a ban: “Total prohibition of smoking in the workplace strongly effects [sic] tobacco industry volume.
Smokers facing these restrictions consume 11%–15% less than average and quit at a rate that is 84% higher than average” 63
States with Smoking Bans--
• As of July 2009, 24 states have enacted statewide bans on smoking in all enclosed public places, including bars and restaurants: Arizona, California, Colorado, Connecticut, Delaware, Hawaii, Illinois,
Iowa, Maine, Maryland, Massachusetts, Minnesota, Montana (effective for bars, casinos, and nightclubs
•
October 1, 2009), Nebraska, New Jersey, New Mexico, New York, Ohio, Oregon, Rhode Island, Utah,
Vermont, Washington, and Wisconsin (effective July 5, 2010). http://en.wikipedia.org/wiki/List_of_smoking_bans_in_the_United_States
IT’S TIME
TEXAS 501(c)(3) Cooper Institute
WELL. INTO THE FUTURE.
TM Appendix IV
AL Stats
10) Tobacco Statistics a. Worldwide
•
•
Tobacco currently kills 5.4 million people per year.
64
The World Health Organization warned that 1 billion people worldwide could die of tobacco use this century unless “urgent action” is taken.
65 b. In the U.S.
• Nearly 1 in every 5 deaths in the United States is a result of smoking, making tobacco use the leading preventable cause of death.
66 c. In Texas
• 24,000 adults die of a smoking-attributable illness every year—that’s more than die from AIDS, heroin, cocaine, alcohol, car accidents, fire and murder combined.
67 d. Youth Smoking
• Each day, approximately 3,600 youth between the ages of 12 and 17 try their first cigarette and more than 1,100 become daily smokers.
68 e. Economic Impact in the U.S.
• Annually, cigarette smoking costs more than $193 billion ($97 billion in lost productivity and $96
• billion in health care expenditures).
69
In 2005, the latest year with available data, the cigarette industry spent almost $13.4 billion, or more than $36 million per day, on advertising and promotional expenses.
70
11) Medicaid Births Information
1. Number of Medicaid Births Each Year a. 2003: 1,495,266 71
2. Percent of Total Births that are “Medicaid covered” a. 2003: 41% 72
3. Associated costs of Medicaid Births a. $6.3 billion was spent in 2004 in the “under 1” category of Medicaid spending- presumably mostly on births.
73
IT’S TIME
TEXAS 501(c)(3) Cooper Institute
WELL. INTO THE FUTURE.
TM Appendix IV
AL Stats
12) Why is Social Support Important for the ACTIVE Life Movement?
1. In general, what are the effects of social support?
• Social and emotional support can increase personal competence, perceived control, sense of stability, and recognition of self-worth.
74
2. How does the ACTIVE Life Movement maximize the potential benefit of social support as a mechanism for positive behavior change?
• By providing a wide variety of social support-oriented resources and letting participants choose which ones they prefer to use, ALM offers individuals the opportunity to determine how involved in the social support aspect of ACTIVE Life they will ultimately be.
3. So, where’s the proof?
• In a nationwide survey of social and emotional support, people who rarely/never received social and emotional support (compared to those who usually/always received social and emotional support) were
50% more likely to smoke, 80% more likely to be physically inactive, 40% more likely to drink heavily, and 10% more likely to be obese.
75
4. Why does it matter?
• 18 million adults in the United States reported they rarely/never received social and emotional support.
76 18 million adults represent approximately 16% of the entire U.S. population.
77 (34% of which are obese.
78 )
13) Social Movements Work a. The Environmental Movement
Consumerism:
• The environmental movement increased consumer awareness of environmental issues so much that it affected their buying habits to the point that companies are desperate to convey an environmentally friendly image, even if it’s not entirely accurate. Case in point, Greenwashing: In the 2009, over 98% of the 2,219 ‘green’ products surveyed in North America made false or misleading environmental claims.
79
IT’S TIME
TEXAS 501(c)(3) Cooper Institute
WELL. INTO THE FUTURE.
TM Appendix IV
AL Stats
Health:
• The Clean Air Act saved 130,000 lives per year between 1970 and1990, for a total of 2.6 million lives. 80
• Today, the vast majority of American households has safe drinking water, and receives annual reports on the quality of their drinking water.
81
Community Impact of the Environmental Movement:
•
•
•
•
Approximately 8,550 curbside recycling programs existed throughout the United States in 2005.
82
Carbon monoxide emissions (CO) have decreased by 33%. Current efforts to reduce emissions from cars, trucks, buses, lawn and construction equipment have resulted in a annual decrease of 41 tons of CO emissions.
83
Today, more than 80 percent of Americans protect their children from secondhand smoke exposure at home.
84
Recycling: According to EPA, the U.S. rose from recycling or composting only 6.4% (5.6 million tons)
• of our trash in 1960 to 33.4% (85 million tons) in 2007.
85
Economic impact of the Environmental Movement:
Recycling has had a major impact on local and state economies through job creation-
In North Carolina, recycling industries employ over 8,700 people.
86
• Recycling employs at least 103,413 people in ten northeastern states found that they employ in recycling.
87
•
•
Washington created 2,050 recycling-based jobs between 1989 and 1992.
88
Massachusetts employs more than 9,000 people in more than 200 recycling enterprises. About half of these jobs are in the recycling-based manufacturing sector. These businesses represent more than half a billion dollars in value added to the state’s economy.
89
• In California, meeting the state’s 50% recycling goal is expected to create about 45,000 recycling jobs,
• over 20,000 of which are slated to be in the manufacturing sector.
90
In Iowa, a 2001 study found that recycling-related end-use manufacturing operations sustain over 23,000 jobs and generate nearly $3.33 billion in total industrial output. The direct manufacturing jobs in Iowa’s recycling industry typically support high wages, on average $47,700 per job.
91
IT’S TIME
TEXAS 501(c)(3) Cooper Institute
WELL. INTO THE FUTURE.
TM Appendix IV
AL Stats
b. The Civil Rights Movement
Policy-- Voting Rates:
•
•
•
Since the mid-1950’s, African-American voter registration has almost tripled, rising from 25% to 70% in
2008.
92 , 93
Between 1964 and 1982, the estimated percentage of black adults registered to vote in Mississippi rose from 6.7% to 75.8%.
94
Post Civil Right’s Movement in 1964, 58% of African Americans voted in the Presidential election.
95
• 65% of African-Americans voted In the November 2008 election.
96
Consumerism--Montgomery Bus Boycott:
• 1955- Rosa Parks refused to give up her seat on the bus to a white man; this resulted in a successful boycott of Montgomery buses in protest to segregation. It was an important start to the Civil Rights
Movement.
97
• The lasting legacy of the boycott, as Roberta Wright wrote, was that “It helped to launch a 10-year national struggle for freedom and justice, the Civil Rights Movement, which stimulated others to do the same at home and abroad.”
Economy: Black/White income ratios since the Civil Rights Movement:
• 10-20% of measured black relative income gains since the Civil Rights Movement were generated by the selective attrition of blacks from the labor force.
98
• 15-20% of black relative gains are explained by schooling quality improvements.
99
Community: Education
• Dropout rate of African American students (age 16 to 24) declined from 20.5 percent in 1976 to 13.0 percent in 1996.
100
Quotes about the Civil Rights Movement: 101
•
•
“I think the Civil Rights movement taught a whole generation that you can go out and take charge of your own history,” Bruce Hartford, veteran of the Civil Rights Movement.
“The [Civil Rights] Movement changed the consciousness of society at large,” Bruce Hartford, veteran of the Civil Rights Movement.
IT’S TIME
TEXAS 501(c)(3) Cooper Institute
WELL. INTO THE FUTURE.
TM Appendix IV
AL Stats
14) Primary Audiences
Youth, Employees/Businesses, and Baby Boomers are primed to become early adopters for the following reasons:
1. Generation Y is cause-oriented:
•
•
61% of 13- to 25-year-olds feel personally responsible for making a difference in the world.
102
83% will trust a company more if it is socially/environmentally responsible.
103
2. Employees are interested in businesses that are socially responsible, and businesses are responding accordingly:
•
•
65% of privately held businesses cite retention and recruitment as their main driver for Corporate Social
Responsibility (CSR).
104
Social responsibility is the 3rd most important driver of employee engagement overall, following only
“improved my skills and capabilities over the last year” and “senior management sincerely interested in employee well-being.” 105
3. Baby Boomers are interested in social change, grew up in a culture shaped by social movements, are increasingly available through mainstream social networks, and should be concerned, as they are largely responsible for the obesity epidemic.
•
•
70% of Baby Boomers feel a responsibility to make the world a better place.
106
54% of the Boomer population, or 40 million of them, can be considered socially conscious shoppers, which they exhibit by supporting companies who give back to the community.
107
IT’S TIME
TEXAS 501(c)(3) Cooper Institute
WELL. INTO THE FUTURE.
TM Appendix IV
AL Stats
(Endnotes)
1 Schlosser, Eric. Fast Food Nation: The Dark Side of the All-American Meal. Houghton Mifflin Press, 2001.
2 Block, Gladys. “Foods contributing to energy intake in the US: data from NHANES III and NHANES 1999-2000.” Journal of
Food Composition and Analysis, Vol. 17, Issues 3-4, June-August 2004.
3 U.S. Department of Health and Human Services and U.S. Department of Agriculture. (2005) Dietary Guidelines for
Americans, 6 th Edition, 2005. Washington, DC, U.S. Government Printing Office.
4 U.S. Department of Health and Human Services and U.S. Department of Agriculture. (2005) Dietary Guidelines for
Americans, 6 th Edition, 2005. Washington, DC, U.S. Government Printing Office.
5 Physical Activity Guidelines Advisory Committee. Physical Activity Guidelines Advisory Committee Report, 2008.
Washington, D.C.: U.S. Department of Health and Human Services, 2008.
6 Research and Innovative Technology Administration, The Bureau of Transportation Statistics, “National Transportation
Survey,” Available at: http://www.bts.gov/programs/national_household_travel_survey/. Accessed July 9, 2009.
7 Centers for Disease Control and Prevention. Trends in leisure time physical inactivity by age, sex, and race/ethnicity-United
States-1994-2004.
MMWR 54:991-994, 2005.
8 Lauren NeerGaard, “Nearly 10% of health spending for obesity,” Associated Press, July 27, 2009.
9 Cynthia L. Ogden, Margaret D. Carroll, Katherine M. Flegal, “High Body Mass Index for Age among US Children and
Adolescents, 2003-2006,” JAMA. 2008; 299(20): 2401-2405 (doi: 10.1001/jama.299.20.2401)
10 Hedley AA, Ogden CL, Johnson CL, Carroll MD, Curtin LR, Flegal KM. (2004). Prevalence of overweight and obesity among US children, adolescents, and adults, 1999–2002. JAMA;291:2847–2850.
11 Olshansky SJ, Passaro DJ, Hershow RC, Layden J, Carnes BA, Brody J, Hayflick L, Butler RN, Allison DB, and Ludwig
DS, “A Potential Decline in Life Expectancy in the United States in the 21st Century,” New England Journal of Medicine , 352:11, pp.
1138-1145.
12 National Institutes of Diabetes and Digestive and Kidney Diseases. “Do You Know the Health Risks of being Overweight?”
U.S. Department of Health and Human Services. http://www.diabetes.niddk.nih.gov/dm/pubs/preventionprogram/. Accessed June 23,
2009
13 Ychiam Ostchega, Sung Sug Yoon, Jeffery Hughes, Tatiana Louis,”Hypertension Awareness, Treatment, and Control--
Continued Disparities in Adults: United States, 2005-2006,” NCHS Data Brief, http://www.cdc.gov/nchs/data/databriefs/db03.pdf.
Accessed June 24, 2009.
14 Jonathan Sorof, Stephen Daniels, “Obesity Hypertension in Children: A Problem of Epidemic Proportions,” Hypertension
2002;40;441-447; (doi: 10.1161/01.HYP.0000032940.33466.12)
15 American Cancer Society, “Diet and Physical Activity: What’s the Cancer Connection?” 2006. Available at: http://www.
cancer.org/docroot/PED/content/PED_3_1x_Link_Between_Lifestyle_and_CancerMarch03.asp. Accessed July 28, 2009.
16 American Cancer Society, “Diet and Physical Activity: What’s the Cancer Connection?” 2006. Available at: http://www.
cancer.org/docroot/PED/content/PED_3_1x_Link_Between_Lifestyle_and_CancerMarch03.asp. Accessed July 28, 2009.
17 Advertising Age. Datacenter: U.S. Measured Ad Spending By Category (2009). Available at: http://adage.com/datacenter/ datapopup.php?article_id=137426. Accessed July 8, 2009.
18 Lobstein and Dibb, 2005
19 Harris, Jennifer L., Bargh, John A., Brownell, Kelly D. Food Advertising and Eating Behavior: Priming Effects of Television
Food Advertising on Eating Behavior, In press: Health Psychology , Accepted September 25, 2008. Available at: http://www.
yaleruddcenter.org/. Accessed July 8, 2009.
20 Harris, Jennifer L., Bargh, John A., Brownell, Kelly D. Food Advertising and Eating Behavior: Priming Effects of Television
Food Advertising on Eating Behavior, In press: Health Psychology , Accepted September 25, 2008. Available at: http://www.
yaleruddcenter.org/. Accessed July 8, 2009.
21 Technomic.com, accessed 7-7-09
22 Tillotson, James E. “Our ready-prepared ready-to-eat nation.” Nutrition Today, January 1, 2002.
23 Martinez, Steve W., The U.S. Food Marketing System 2002. USDA ERS. http://www.ers.usda.gov/publications/aer811/
24 Cutler, David M., Glaeser, Edward L., & Shapiro, Jesse M. (2003). Why have Americans Become More Obese? Journal of
Economic Perspectives , 17(3), 93-118
25 Entertainment Software Association. Sales and Genre Data (2009). Available at: http://www.theesa.com/facts/salesandgenre.
asp. Accessed July 8, 2009
IT’S TIME
TEXAS 501(c)(3) Cooper Institute
WELL. INTO THE FUTURE.
TM Appendix IV
AL Stats
26 Natural Resources Defense Council, “Transportation Bill Could Promote Inactivity, Intensify Obesity Epidemic,” March 17,
2004. Available at: http://www.nrdc.org/media/pressreleases/040317.asp. Accessed July 9, 2009.
27 Frumpkin, H. (2002, May/June). Urban Sprawl and Public Health. Public Health
Reports, 117 (3).
28 Frank, L.D., Andresen, M., & Schmidt, T. (2004). Obesity relationships with community design, physical activity, and time spent in cars. American Journal of Preventive Medicine , 27(2), 87-96
29 Frank, L.D. et al (2006). Many Pathways from Land Use to Health. Journal of the American Planning Association, 72(1)
75-87
30 Chou, Shin-Yi, Grossman, Michael, Saffer, Henry. An Economic Analysis of Adult Obesity: Results From the Behavioral
Risk Factor Surveillance System.
Economic Research Service, USDA. E-FAN No. (04004) 45 pp, May 2004
31 Cohen DA, Farley TA, Mason K, “Why is poverty unhealthy? Social and physical mediators,” Social Science & Medicine ,
57(9), pp.1631-1641. 2003.
32 Morland K, Wing S, Diez Roux AV, Poole G. Neighborhood characteristics associated with the location of food stores and food service places. Am J Prev Med. 2002;22:23-9.
33 Ibid.
34 L. Powell, S. Slater, D. Mirtcheva, Y. Bao and F. Chaloupka. Food store availability and neighborhood characteristics in the
United States. Prev Med.
2007;44: 189–195.
35 L. Powell, S. Slater, D. Mirtcheva, Y. Bao and F. Chaloupka. Food store availability and neighborhood characteristics in the
United States. Prev Med.
2007;44: 189–195.
36 L. Powell, S. Slater, D. Mirtcheva, Y. Bao and F. Chaloupka. Food store availability and neighborhood characteristics in the
United States. Prev Med.
2007;44: 189–195.
37 Alwitt LF, Donley TD. Retail stores in poor urban neighborhoods. J Consum Aff. 2005;31(1):139-64.
38 EPA, National Air Quality Status and Trends through 2007, www.epa.gov
39 EPA, National Air Quality Status and Trends through 2007, www.epa.gov
40 California Environmental Protection Agency. Proposed Identification of Environmental Tobacco Smoke as a Toxic Air
Contaminant. Final report, September 29, 2005, approved by Scientific Review Panel on June 24, 2005. Available at: http://www.arb.
ca.gov/toxics/ets/ets.htm. Accessed August 5, 2009.
41 EPA, Smoke-free Homes and Cars Program, Available at: http://www.epa.gov/smokefree/healtheffects.html. Accessed
August 4, 2009.
42 Becklake, M.R.,; Ghezzo, H.; Ernst, P., “Childhood predictors of smoking in adolescence: a follow-up study of Montreal schoolchildren,” CMAJ 173(4): 377-379, August 16, 2005. Available at http://www.cmaj.ca/cgi/reprint/173/4/377.
43 U.S. Centers for Disease Control and Prevention. “Preventing Obesity and Chronic Diseases through Good Nutrition and
Physical Activity.” U.S. Department of Health and Human Services, http://www.cdc.gov/nccdphp/publications/factsheets/Prevention/ obesity.htm. Accessed June 23, 2009
44 U.S. Centers for Disease Control and Prevention. “Preventing Obesity and Chronic Diseases through Good Nutrition and
Physical Activity.” U.S. Department of Health and Human Services, http://www.cdc.gov/nccdphp/publications/factsheets/Prevention/ obesity.htm. Accessed June 23, 2009
45 Trust for America’s Health, “F as in Fat: How Obesity Policies are Failing in America 2008.” Robert Wood Johnson
Foundation. http://healthyamericans.org/reports/obesity2008/Obesity2008Report.pdf. Accessed June 23, 2009
46 American Diabetes Association, “Economic Costs of Diabetes in the U.S. in 2007,” Diabetes Care , 31:3, March 2008
47 American Heart Association. Heart disease and stroke statistics--2006 update. Circulation. 2009
48 U.S. Department of Education, National Center for Education Statistics (2009).
Digest of Education Statistics, 2008 , Chapter
2.
49 Rosen, B. and L. Barrington. Weights & Measures: What Employers Should Know about Obesity.
New York, NY: The
Conference Board, April 2008.
50 Susan Combs, “Counting Costs and Calories,” March 2007
51 Lakdawalla, Darius, Philipson, Tomas. The Economics of Obesity. Economic Research Service, USDA. E-FAN No. (04004)
45 pp, May 2004
52 Gallo, AE. Food advertising in the United States. In: Frazao E, ed. America’s eating habits: Changes and consequences.
ERS, U.S.D.A., 1997. Available at: http://www.ers.usda.gov/publications/aib750/aib750i.pdf. Accessed July 8, 2009
IT’S TIME
TEXAS 501(c)(3) Cooper Institute
WELL. INTO THE FUTURE.
TM Appendix IV
AL Stats
53 Ryan E. Rhodes, Darren E. R. Warburton, Holly Murray, “Characteristics of Physical Activity Guidelines and their Effect on
Adherence,” Sports Medicine , 2009;39;5;355-375
54 Justin G. Trogdon, James Nonnemaker, Joanne Pais, “Peer effects in adolescent overweight,” Journal of Health Economics ,
2008; 27; 1388-1399; (doi: 10.1016/j.jhealeco.2008.05.003)
55 Schoonover, Heather and Muller, Mark, Institute for Agriculture and Trade Policy: Environment and Agriculture Program,
Food without thought: How U. S. Farm Policy Contributes to Obesity (2006). Available at: http://www.iatp.org/iatp/publications.
cfm?accountID=421&refID=80627. Accessed July 10, 2009.
56 Schoonover, Heather and Muller, Mark, Institute for Agriculture and Trade Policy: Environment and Agriculture Program,
Food without thought: How U. S. Farm Policy Contributes to Obesity (2006). Available at: http://www.iatp.org/iatp/publications.
cfm?accountID=421&refID=80627. Accessed July 10, 2009.
57
58
Data from USDA ERS Food Review, Vol. 25, Issue 3. Converted to real dollars.
Natural Resources Defense Council, “Transportation Bill Could Promote Inactivity, Intensify Obesity Epidemic,” March 17,
2004. Available at: http://www.nrdc.org/media/pressreleases/040317.asp. Accessed July 9, 2009.
59 Natural Resources Defense Council, “Transportation Bill Could Promote Inactivity, Intensify Obesity Epidemic,” March 17,
2004. Available at: http://www.nrdc.org/media/pressreleases/040317.asp. Accessed July 9, 2009.
60 CDD, “Federal and State Cigarette Excise Taxes--United States, 1995-2009.” Available at: http://www.cdc.gov/mmwr/ preview/mmwrhtml/mm5819a2.htm. Accessed July 24, 2009.
61 Ibid..
62 Bartecchi C, Alsever RN, Nevin-Woods C, et al. (October 2006). “Reduction in the incidence of acute myocardial infarction associated with a citywide smoking ordinance”. Circulation 114 (14): 1490–6. doi:10.1161/CIRCULATIONAHA.106.615245.
63 John Heironimus (1992-01-21). “Impact of Workplace Restrictions on Consumption and Incidence” (PDF). http://legacy.
library.ucsf.edu/cgi/getdoc?tid=qhs55e00&fmt=pdf&ref=results. Accessed July 24, 2009.
64 WHO Report on the Global Tobacco Epidemic, 2008. Available at: http://www.who.int/tobacco/mpower/en/. Accessed
August 4, 2009.
65 WHO Report on the Global Tobacco Epidemic, 2008. Available at: http://www.who.int/tobacco/mpower/en/. Accessed
August 4, 2009.
66 American Cancer Society, Prevention and Early Detection, “Cigarette Smoking”. Available at: http://www.cancer.org/ docroot/PED/content/PED_10_2X_Cigarette_Smoking.asp. Accessed August 5, 2009.
67 Centers for Disease Control and Prevention. Smoking-Attributable Mortality, Morbidity, and Economic Costs (SAMMEC):
Adult SAMMEC and Maternal and Child Health (MCH) SAMMEC Software. Available at: http://www.cdc.gov/tobacco/sammec.
68 Substance Abuse and Mental Health Services Administration. 2007 National Survey on Drug Use and Health. Available at: http://www.oas.samhsa.gov/nsduh/2k7nsduh/2k7Results.pdf. Accessed August 5, 2009
69 Centers for Disease Control and Prevention. Smoking-Attributable Mortality, Years of Potential Life Lost, and Productivity
Losses—United States, 2000–2004. Morbidity and Mortality Weekly Report [serial online]. 2008;57(45):1226–1228. Accessed
August 4, 2009.
70 Federal Trade Commission. Cigarette Report for 2004 and 2005 (PDF–880 KB). Washington, DC: Federal Trade
Commission; 2007. Accessed August 4, 2009.
71 Kaiser State Health Facts, “Total Medicaid Births.” Available at: http://www.statehealthfacts.org/comparemaptable.
jsp?ind=222&cat=4. Accessed July 23, 2009
72 Kaiser State Health Facts, “As Percent of Total Births.” Available at: http://www.statehealthfacts.org/comparemaptable.
jsp?ind=223&cat=4. Accessed July 23, 2009
73 Fiscal Year 2004 National MSIS Tables, Medicaid Statistical Information System State Summary FY2004 (2007). Available at: http://www.cms.hhs.gov/MedicaidDataSourcesGenInfo/downloads/MSISTables2004.pdf. Accessed July 23, 2009
74 Langford CP, Bowsher RS, Ensel WM, Kuo W, “Social support: a conceptual analysis,” J Adv Nurs. 25(1), pp. 95-100
75 Strine TW, Chapman DP, Balluz L, Mokdad AH, “Health-related quality of life and health behaviors by social and emotional support,” Social Psychiatry and Psychiatric Epidemiology, (2008). 43(2), pp.151-159
76 Strine TW, Chapman DP, Balluz L, Mokdad AH, “Health-related quality of life and health behaviors by social and emotional support,” Social Psychiatry and Psychiatric Epidemiology, (2008). 43(2), pp.151-159
77 Population, United States. www.google.com/publicdata
78 CDC, National Center for Health Statistics, “Prevalence of overweight and obesity among adults: United States, 2003-2004.”
79 TerraChoice, “The Seven Sins of Greenwashing,” April 2009. Available at: http://sinsofgreenwashing.org/findings/ greenwashing-report-2009/. Accessed July 24, 2009.
80 R. Harold Brown, “Clearing the Air on Saving Americans’ Lives,” Georgia Public Policy Foundation, 2004. Available at
:http://www.gppf.org/article.asp?RT=19&p=pub/AirQuality/EPALives040116.htm. Accessed July 23, 2009.
IT’S TIME
TEXAS 501(c)(3) Cooper Institute
WELL. INTO THE FUTURE.
TM Appendix IV
AL Stats
81
82
EPA, “Environmental Progress.” Available at: http://www.epa.gov/earthday/history.htm. Accessed July 23, 2009
Chait J, Michaels W, Pullen K. “Current United States Recycling Statistics.” Available at: http://greenliving.lovetoknow.
com/United_States_Recycling_Statistics. Accessed July 22, 2009
83 Michaels W. “Air Pollution Statistics.” Available at: http://greenliving.lovetoknow.com/Air_Pollution_Statistics. Accessed
July 22, 2009
84 EPA, “Environmental Progress.” Available at: http://www.epa.gov/earthday/history.htm. Accessed July 23, 2009
85 NSWMA WASTEC, Frequently Asked Questions, Available at: http://www.environmentalistseveryday.org/publicationssolid-waste-industry-research/faq/recycling.php, Accessed July 10, 2009
89
90
91
92
86 Waste to Wealth, “Recycling Means Business,” (2006). Available at: http://www.ilsr.org/recycling/recyclingmeansbusiness.
html. Accessed July 23, 2009
87
88
Ibid.
Ibid.
Ibid.
Ibid.
Ibid.
Young R, “African American Voting Patterns,” Black Voting Demographics 2008 Democratic Primary Statistics, August 7,
2008. Available at: http://racism-politics.suite101.com/article.cfm/african_american_voting_patterns. Accessed July 29, 2009
93 U.S. Census Bureau, Voting and Registration in the Election of November 2008. Available at: http://www.census.gov/ population/www/socdemo/voting/cps2008.html. Accessed July 29, 2009.
94 Andrews KT, “The impacts of social movements on the political process: The civil rights movement and Black electoral politics in Mississippi,” American Sociological Review, 62(5), pp. 800-819
95 Young R, “African American Voting Patterns,” Black Voting Demographics 2008 Democratic Primary Statistics, August 7,
2008. Available at: http://racism-politics.suite101.com/article.cfm/african_american_voting_patterns. Accessed July 29, 2009
96 U.S. Census Bureau, Voting and Registration in the Election of November 2008. Available at: http://www.census.gov/ population/www/socdemo/voting/cps2008.html. Accessed July 29, 2009.
97 Cozzens L, “The Montgomery Bus Boycott,” 1997. Available at: http://www.watson.org/~lisa/blackhistory/ civilrights-55-65/montbus.html. Accessed July 29, 2009
98 Card D, Krueger AB, “Trends in Relative Black-White Earnings Revisited,” The American Economic Review, Vol. 83, No.
2, Papers and Proceedings of the Hundred and
Fifth Annual Meeting of the American Economic Association. (May, 1993), pp. 85-91
99 Card D, Krueger AB, “Trends in Relative Black-White Earnings Revisited,” The American Economic Review, Vol. 83, No.
2, Papers and Proceedings of the Hundred and
Fifth Annual Meeting of the American Economic Association. (May, 1993), pp. 85-91
100 Dropout Rates in the United States: 1996, table A23, page 58.
101 Veterans of the Civil Rights Movement, “Did the civil rights movement have an impact on the whole of the US population or just African-Americans?” Available at: http://www.crmvet.org/faq/faqallus.htm. Accessed July 30, 2009
102 Cone Millennial Cause Study, 2006
103 Cone Millennial Cause Study, 2006
104 Grant Thornton, “Corporate Social Responsibility-a necessity not a choice for privately held businesses,” 2008. http:// internationalbusinessreport.com/Press-room/2008/corporate-social-responsibility.asp
105 Towers Perrin Global Workforce Study--Global Report, 2007-2008.
106 AARP Focalyst Insight Report, “It’s Good to Be Green: Socially Conscious Shopping Behaviors Among Boomers,”
December 2007. http://assets.aarp.org/rgcenter/general/green_boomers_1.pdf
107 AARP Focalyst Insight Report, “It’s Good to Be Green: Socially Conscious Shopping Behaviors Among Boomers,”
December 2007. http://assets.aarp.org/rgcenter/general/green_boomers_1.pdf
IT’S TIME
TEXAS 501(c)(3) Cooper Institute
WELL. INTO THE FUTURE.
TM Appendix IV
AL Stats
