East Carolina University
advertisement
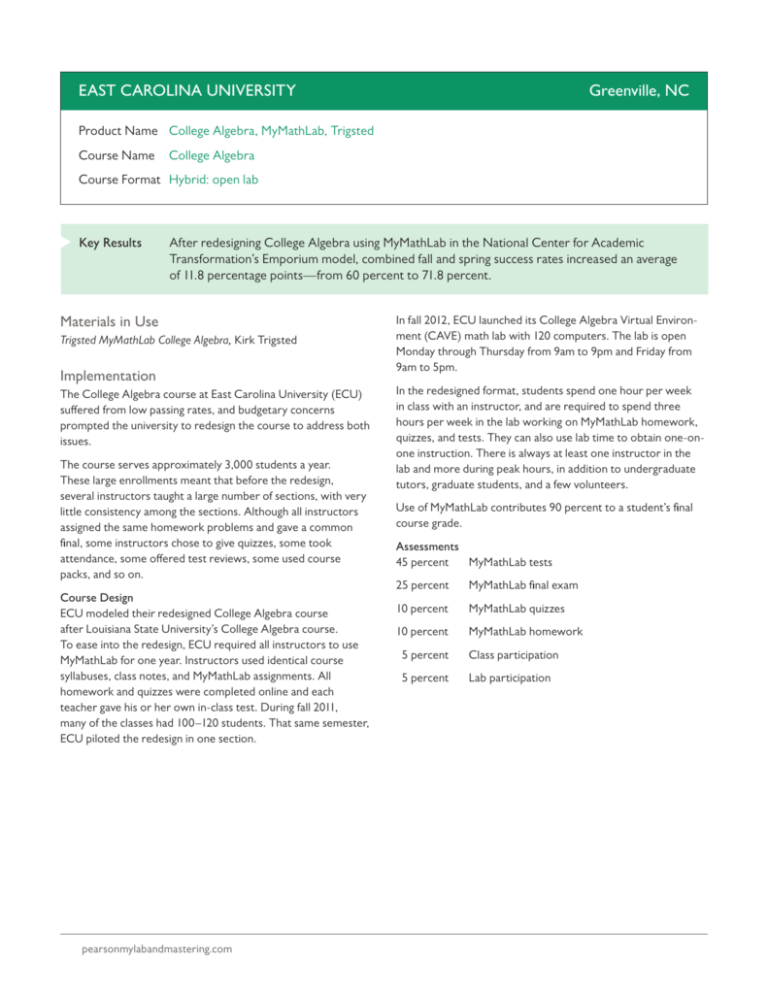
EAST CAROLINA UNIVERSITY Greenville, NC Product Name College Algebra, MyMathLab, Trigsted Course Name College Algebra t Course Format Hybrid: open lab Key Results After redesigning College Algebra using MyMathLab in the National Center for Academic Transformation’s Emporium model, combined fall and spring success rates increased an average of 11.8 percentage points—from 60 percent to 71.8 percent. Materials in Use Trigsted MyMathLab College Algebra, Kirk Trigsted Implementation The College Algebra course at East Carolina University (ECU) suffered from low passing rates, and budgetary concerns prompted the university to redesign the course to address both issues. The course serves approximately 3,000 students a year. These large enrollments meant that before the redesign, several instructors taught a large number of sections, with very little consistency among the sections. Although all instructors assigned the same homework problems and gave a common final, some instructors chose to give quizzes, some took attendance, some offered test reviews, some used course packs, and so on. Course Design ECU modeled their redesigned College Algebra course after Louisiana State University’s College Algebra course. To ease into the redesign, ECU required all instructors to use MyMathLab for one year. Instructors used identical course syllabuses, class notes, and MyMathLab assignments. All homework and quizzes were completed online and each teacher gave his or her own in-class test. During fall 2011, many of the classes had 100–120 students. That same semester, ECU piloted the redesign in one section. 4 • pearsonmylabandmastering.com In fall 2012, ECU launched its College Algebra Virtual Environment (CAVE) math lab with 120 computers. The lab is open Monday through Thursday from 9am to 9pm and Friday from 9am to 5pm. In the redesigned format, students spend one hour per week in class with an instructor, and are required to spend three hours per week in the lab working on MyMathLab homework, quizzes, and tests. They can also use lab time to obtain one-onone instruction. There is always at least one instructor in the lab and more during peak hours, in addition to undergraduate tutors, graduate students, and a few volunteers. Use of MyMathLab contributes 90 percent to a student’s final course grade. Assessments 45 percent MyMathLab tests 25 percent MyMathLab final exam 10 percent MyMathLab quizzes 10 percent MyMathLab homework 5 percent Class participation 5 percent Lab participation East Carolina University “Math is not a spectator sport. An instructor can stand up and do the problems all day long, but until students practice it, they’re not going to get it. MyMathLab forces students to do math, which is what they need to do to see success.” The Student Experience At first, most students didn’t like the learning curve associated with MyMathLab and the course redesign. Faculty listened to their concerns and made adjustments. Percentage of Students 100% 75.5% 80% 66.8% 72.7% 70.9% 61.4% 60% 53.2% 40% 20% 0% Fall Before Redesign (Fall 2007– Spring 2011) Spring Hybrid (Fall 2011– Spring 2012) After Redesign with MyMathLab (Fall 2012–Spring 2013) Figure 1. College Algebra Average ABC Rates by Fall and Spring, before Redesign (Fall Semesters, n = 8,689; Spring Semesters, n = 4,904), during the Hybrid Format (Fall Semesters, n = 2,133; Spring Semesters, n = 1,019), and after Redesign (Fall Semesters, n = 2,684; Spring Semesters, n = 1,188), Fall 2007–Spring 2013 For example, better students who often finished their work before the three hours of lab time per week were up would run out of work to do and become frustrated. Faculty responded by allowing students who had a 95 average after the first exam and a 100 average on all their assignments for the week to be exempt from the three-hour rule that week. Students appreciate the help and flexibility that MyMathLab provides: • “The CAVE gave me easy access to instructors for any questions I had, including computer problems and homework. Being allowed to take the quizzes up to 10 times helped my grade and helped me learn.” • “The online assignments walking me through the problems and helped me understand them.” • “Having instructors in the math lab is a good resource for when we don’t understand the material.” Results and Data Conclusion Prior to redesign, College Algebra average fall ABC rates were as low as 66.8 percent; average spring ABC rates were as low as 53.2 percent. After redesign with MyMathLab, fall ABC rates increased 5.9 percentage points to 72.7 percent; spring ABC success rates increased 17.7 percentage points to 70.9 (figure 1). East Carolina University is seeing significant positive results in a short amount of time. With the data they’ve gathered thus far, the math department plans to continue modifying the program to include personalized homework assignments and a new coursepack that requires students to read the e-text prior to attending class. Submitted by Cathy Wilkerson, Lab Director and Mathematics Instructor (retired) and April Church, Teaching Instructor and CAVE Director/ Math 1065 Course Coordinator East Carolina University pearsonmylabandmastering PearsonCourseConnect.com • 5
