Experiment 9
advertisement

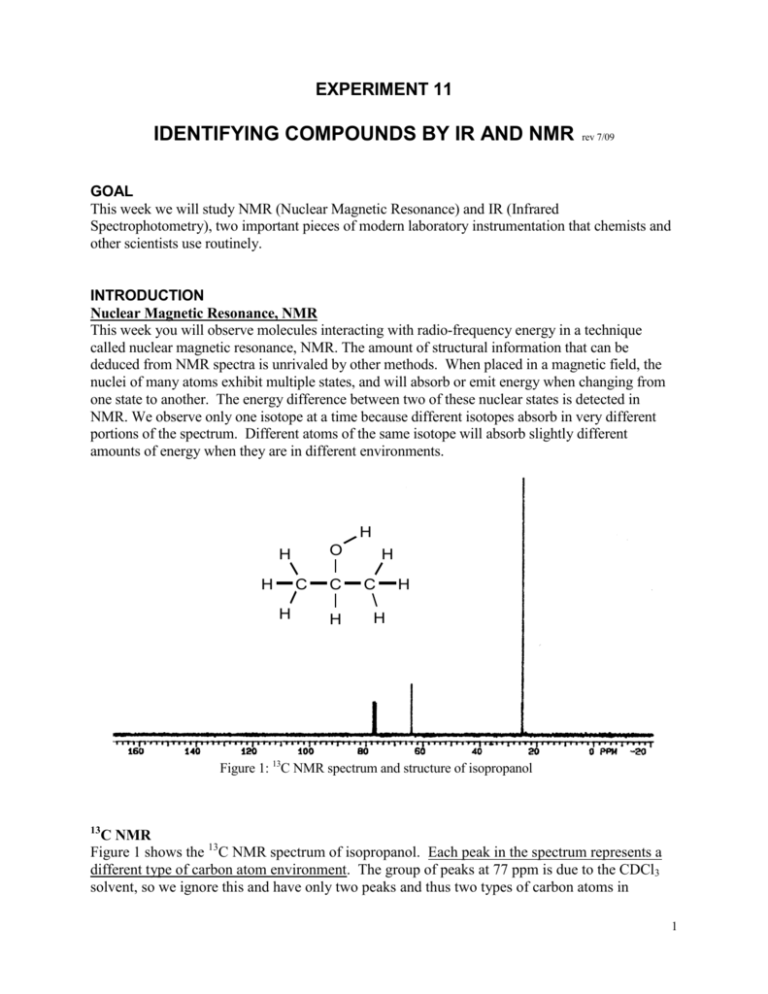
EXPERIMENT 11 IDENTIFYING COMPOUNDS BY IR AND NMR rev 7/09 GOAL This week we will study NMR (Nuclear Magnetic Resonance) and IR (Infrared Spectrophotometry), two important pieces of modern laboratory instrumentation that chemists and other scientists use routinely. INTRODUCTION Nuclear Magnetic Resonance, NMR This week you will observe molecules interacting with radio-frequency energy in a technique called nuclear magnetic resonance, NMR. The amount of structural information that can be deduced from NMR spectra is unrivaled by other methods. When placed in a magnetic field, the nuclei of many atoms exhibit multiple states, and will absorb or emit energy when changing from one state to another. The energy difference between two of these nuclear states is detected in NMR. We observe only one isotope at a time because different isotopes absorb in very different portions of the spectrum. Different atoms of the same isotope will absorb slightly different amounts of energy when they are in different environments. H O H H C H C H H C H H Figure 1: 13C NMR spectrum and structure of isopropanol 13 C NMR Figure 1 shows the 13C NMR spectrum of isopropanol. Each peak in the spectrum represents a different type of carbon atom environment. The group of peaks at 77 ppm is due to the CDCl3 solvent, so we ignore this and have only two peaks and thus two types of carbon atoms in 1 isopropanol. Although it has a total of three carbon atoms, the two end carbons in isopropanol are identical and show up in the same NMR peak. 13 C NMR Summary 1. number of peaks = number of types of C atoms 2. peak position tells what the C atom is attached to (see Table 1) 3. ignore the CDCl3 solvent peak at 77 ppm 1 H NMR: Now let’s switch nuclei and look at 1H NMR. Figure 2a shows the 1H NMR spectrum of isopropanol. Remember that we are considering only the hydrogen atoms this time. 1H NMR is more complicated than 13C NMR, but rewards us with more information. Just as the number of peaks in the 13C NMR told the number of types of carbon atoms, the number of peaks in the 1H NMR tells us the number of types of hydrogen atoms. The spectrum also tells us how many hydrogen atoms of each type are present, and how many hydrogen atoms are on the neighboring carbon atoms. Look closely at the spectrum in Figure 2a. It shows three peaks, representing the three types of hydrogen atoms in isopropanol. These peaks aren’t as simple as the ones in our 13C spectrum. The peak at 1.25 ppm is split into two closely spaced peaks; this unit is called a doublet. The peak at 3.95 ppm is split into seven closely spaced peaks; this unit is called a septet. For the moment, ignore this extra splitting. Look at the structure of isopropanol in Figure 2a. You should be able to convince yourself that this structure has three types of hydrogen atoms: six identical hydrogen atoms from the end -CH3 groups, one hydrogen on the central carbon atom, and one hydrogen on the oxygen. So the three types of hydrogen match up with the spectrum’s three peaks, but which peak corresponds to which type of hydrogen? As with the 13C NMR spectrum, the positions of the peaks tell us what they hydrogen atoms are attached to. The presence of double bonds and more electronegative elements such as oxygen or halogens moves peaks further to the left. While peak position provides useful information, we will focus on area and splitting to identify peaks. One way to tell which peak goes with which atoms is to look at the area under the curve for each peak. The integrated area of a peak is proportional to the number of hydrogen atoms it represents. Our structure has six hydrogen atoms of one type, so the peak that corresponds to these hydrogens should have an integrated area six times larger than the other peaks. Just from looking at the spectrum, you can see that the peak at 1.25 is much larger than the others and probably corresponds to the six -CH3 type hydrogen atoms. The small numbers that appear directly below each peak are the integrated areas of those peaks as measured by the NMR instrument. We make a ratio of these areas and then reduce the ratio. From our spectrum, the areas are 31.7 : 37.7 : 190.1 which reduces to approximately 1:1:6. We now know that the peak at 1.25 ppm is due to six identical hydrogen atoms, so this must be the six -CH3 type hydrogen atoms. 2 Figure 2a: Structure and 1H NMR Spectrum of Isopropanol Figure 2b: Expanded Septet H O H H C H C H H C H H How can we decide which of the two remaining hydrogen atoms gives rise to each of the two other peaks? Now we look at the splitting. Splitting tells us how many hydrogen atoms are on the nearest neighbor carbon atom. For every “n” hydrogen atoms on immediate neighbor carbon atoms, a peak will be split into “n+1” parts. Look at the structure of isopropanol again and focus on the hydrogen atom on the central carbon. That central carbon sees three hydrogen atoms on the carbon immediately to its left and three additional hydrogen atoms on the carbon immediately to its right, for a total of six hydrogen atoms on the immediate neighbor carbon atoms. Six neighbors will split the peak for this central hydrogen atom into seven parts, forming a septet. So, we now know that the peak centered at 3.95 ppm is due to hydrogen attached to the central carbon atom because its splitting matches with the number of neighbor hydrogen atoms. By process of elimination the broad peak at 2.45 ppm must be due to the hydrogen attached to the oxygen. Does the splitting work out consistently for the other atoms? Why is the peak at 1.25 split into a doublet? Recall that we assigned this peak to the six -CH3 type hydrogen atoms. Look back at the structure of isopropanol. Here the immediate neighbor carbon is the central carbon atom. It has only one hydrogen on it, so the -CH3 peak will be split in two, forming a doublet. What about the hydrogen on the oxygen? Its peak is a singlet, i.e. it remains unsplit. Hydrogen atoms attached to oxygen atoms almost never show splitting, so this is to be expected. 1 1. 2. 3. 4. 5. 6. H NMR Summary number of peaks = number of types of H atoms peak position tells what the H atom is attached to (but we won’t use this today) area under a peak is proportional to the number of H atoms of that type splitting is caused by H atoms on immediately neighboring carbon atoms “n” neighbors give a splitting into “n+1” peaks hydrogen atoms bonded to oxygen atoms don’t show splitting 3 Infrared Spectroscopy, IR The vibrational state of a molecule may be studied by infrared spectroscopy. The bonds in a molecule bend and stretch almost as if they were small springs stretching and contracting constantly. Just as some springs are easier to stretch than others, different types of bonds vibrate at different frequencies. The characteristic frequency of a given type of bond corresponds to the energy that the bond will absorb. Table 2 lists some common types of bonds and the energies that they absorb. As you can see, the amount of energy required to cause such vibrations falls in the infrared (IR) region of the electromagnetic spectrum. This means that by observing which energies of light a molecule absorbs in the IR, we can determine which Bond Absorption Range, cm-1 types of bonds the molecule contains. For example, type if a molecule absorbs light at 1750 cm-1 we could O–H 3600-3200 (usually broad) conclude that it contains a C=O bond. Certain C–H 3300-2800 absorption bands also have characteristic shapes. B–H 2650-2300 The O-H absorption is usually very broad, so a C ≡ N 2260-2220 small sharp band at 3400 cm-1 may not be an O-H C=O 1780-1630 (usually strong) stretch even though it is the correct region. A small Table 2: IR frequencies peak in this area may mean only that the sample or holder used was a little wet. (H2O has an O-H stretch!) HAZARDS Although the unknowns are not particularly hazardous, you should still take reasonable care to avoid prolonged contact of these compounds with the skin or prolonged inhalation of the vapors. The unused portion of the unknowns should be kept in their original containers and returned to the instructor. The NMR instrument contains a very strong magnet. Persons with pacemakers and metal prosthetic devices can also be harmed, and should not approach closer than five feet from the magnet until it has been determined that a closer approach is not harmful. (The printers, screen, and keyboard are not magnetic and are six feet from the magnet.) PROCEDURE You will be working with an assigned partner. You should work as a team on all aspects of this experiment and turn in a single lab report for your team. Each person should do the normal pre-lab entry in your own notebook, but once in lab all data will be recorded directly in the data tables at the end of this experiment. Finish your report before leaving lab--staple your report, NMR spectra, IR spectrum, and pre-lab pages together, and turn this in before leaving lab. Part 1: Learning about NMR Large organic molecules are often composed of small, familiar units connected in new ways. By recognizing these small units, we can simplify our understanding of the larger molecules. On the data sheet provided, determine what the 1H and 13C NMR spectra of the listed organic units will look like. Your unknown for Part 2 will include some of these units, so you will use your Part 1 analysis to identify your Part 2 unknown. Use the description of the iso-propyl group from the introduction as a guide as you predict the number and type of peaks expected for n-propyl, ethyl, and methyl groups on the data sheet. 4 Part 2 Obtaining your NMR Spectrum Before going to the NMR room (Trexler 162) prepare your sample in the regular lab room. Attach a new tip to the automatic pipetter that is set for 40 L (0.040 mL) and pipet this volume of your NMR unknown into a clean NMR tube. Record the number of the unknown. Then place the NMR tube in the measuring tube and add the NMR solvent, CDCl3, until the liquid level is between the lines. This places 0.7 to 0.8 mL in the tube, the necessary volume. Be sure to close the stock bottle of CDCl3. Cap, mix, and take this sample to the NMR in room 162 where the instructor will help you record the 13C and 1H NMR spectra. Part 3 Identifying your NMR Unknown Follow the directions on the report sheet pages. Part 4: Learning about Infrared Spectroscopy (IR) Two IR spectra are given on your data sheets. Use Table 2 to identify the bond types that correspond to bands above 1630 cm-1 in each spectrum. Part 5: Obtaining your IR Spectrum and Identifying your Unknown Take your “IR Unknown” to room 572. An instructor will demonstrate the proper way to prepare your sample and operate the Perkin-Elmer infrared spectrophotometer. Once you have your spectrum, see which of the types of bonds listed in Table 2 your molecule contains. This narrows down the possible unknown identities. Now compare your spectrum with the spectra of the knowns that contain the same types of bonds. Spectra of the knowns will be provided in the lab. On your data sheet record the types of bonds that you conclude are in your unknown along with the position of the absorptions that lead to your conclusions. Finally record the identity of your “IR Unknown.” LABORATORY REPORT The Laboratory Report for this experiment consists of completing the following pages in this manual. Attach your NMR and IR spectra and then turn in your report before leaving lab. Be sure that you have not skipped any questions or parts of questions as you have skipped around doing the various parts of this experiment. 5 LABORATORY REPORT FOR Identifying Compounds by IR and NMR Team Members: ____________________________ Date __________ ____________________________ Part 1: Learning about NMR 1. Complete the table predicting only the number of peaks (number of types of carbon) for 13C NMR. For 1 H NMR predict the number of peaks (number of types of hydrogen). Then for each of these peaks, predict the splitting multiplicities (from the number of neighbors), and the peak area (number of hydrogen atoms of that type). Use the introduction as your guide, especially the Summary Boxes on Pages 2 and 3. The open bond in each structure may be ignored; it has no effect on the spectra you will see. The entry for the iso-propyl group and part of the entry for n-propyl have been completed for you. Use these as a check of your understanding. H 13 H H C C H C H C number of types of C = 2 1 H number of types of H = 2 Splitting and area for each: -doublet of area 6 -septet of area 1 13 C number of types of C = 3 H H iso-propyl H H C H H H C C 1 H number of types of H = 3 H H Splitting and area for each: - n-propyl H H C H H 13 C 1 H C number of types of C = H number of types of H = Splitting and area for each: ethyl 2. The 13C NMR spectrum of 2-methyl propane (see structure at right and model in lab) has two peaks. Explain why. How many peaks do you expect for its 1H NMR spectrum? Give the splitting multiplicity and area for each 1H peak. Explain your reasoning. H H H C H C H C H C H H H H 6 3. Consider the structure at right. How many different types of carbon atoms are present? This is equal to the total number of peaks expected in the 13C spectrum. H H OH H C C C C H H H H Number of types of carbon atoms and total peaks expected in 13C spectrum = _________ Part 2: Obtaining your NMR Spectrum Follow the directions in the procedure section. Record your unknown number ______ Part 3: Identifying your NMR Unknown 1. Examine the 13C NMR spectrum of your unknown. Recall that the peaks near 77 ppm are just our CDCl3 solvent and will be ignored. List the peaks below (you may not need all the spaces). Peak 1 2 3 4 5 Position (in ppm) How many total carbon environments (peaks) did you find? ________ 2 Examine the 1H NMR spectrum for your unknown. List the peaks below. Recall that the solvent peak may show at 7.2 ppm and should be ignored. Also ignore tiny impurities. Your unknown may have fewer peaks than there are lines in the table. After you record the integrated peak areas as given on the spectrum, reduce the ratio of areas to the smallest, whole number proportion. Peak Position (in ppm) Splitting (singlet, doublet, etc.) Integrated Peak Area (shown below peak on spectrum) Reduced Ratio of Areas 1 2 3 4 5 7 3. Now compare the table you just completed to the table you filled out in Part 1. Decide whether your unknown contains an ethyl, n-propyl, or iso-propyl group. Focus your attention mostly on the “splitting” and “reduced ratio of areas” columns. Remember that your unknown spectrum may have some extra peaks because your unknown compound may contain something in addition to the ethyl, n-propyl, or iso-propyl group. Which of the three groups is present in your unknown? Explain your reasoning clearly. 4. Go to the posted listing of possible NMR unknowns and find the page that corresponds to the number of carbon environments you counted for your unknown (in Part 3, Step 1). Notice that each possible unknown contains either an ethyl, n-propyl, or iso-propyl group along with some additional groups. Since you just decided above which of these groups is present in your unknown, you should be able to decide which of the compounds is your unknown. Copy its structure and name below. Part 4: Learning about Infrared Spectroscopy (IR) Use Table 2 on Page 4 to assign bond types that correspond to bands above 1630 cm-1 in the two IR spectra shown below. Spectrum #1 Band position (cm-1) Bond type _______________ ________ _______________ ________ _______________ ________ 8 Spectrum #2 Band position (cm-1) Bond type _______________ ________ _______________ ________ _______________ ________ Part 5: Obtaining your IR Spectrum and Identifying your Unknown Follow the directions in the Procedure Section “IR Unknown” number _______________ Band position, cm -1 Bond type in your compound _______________ _______________ _______________ _______________ _______________ _______________ ________________ _______________ Identity of Unknown _______________ ATTACH your IR spectrum to your lab report 9 Summary: IR and NMR both help chemists learn about a molecule’s structure. Think about how the information we get about structure from each is similar and different. Some of the techniques chemists use are simple and fast but provide limited information. Other techniques are harder or longer but provide more information. Think about how NMR and IR fit in these descriptions. Write a paragraph comparing IR and NMR for the information provided about structures and also for ease of use versus amount of information provided. 10


