Chem 332 Analytical Chemistry Exam I Show all work for partial
advertisement
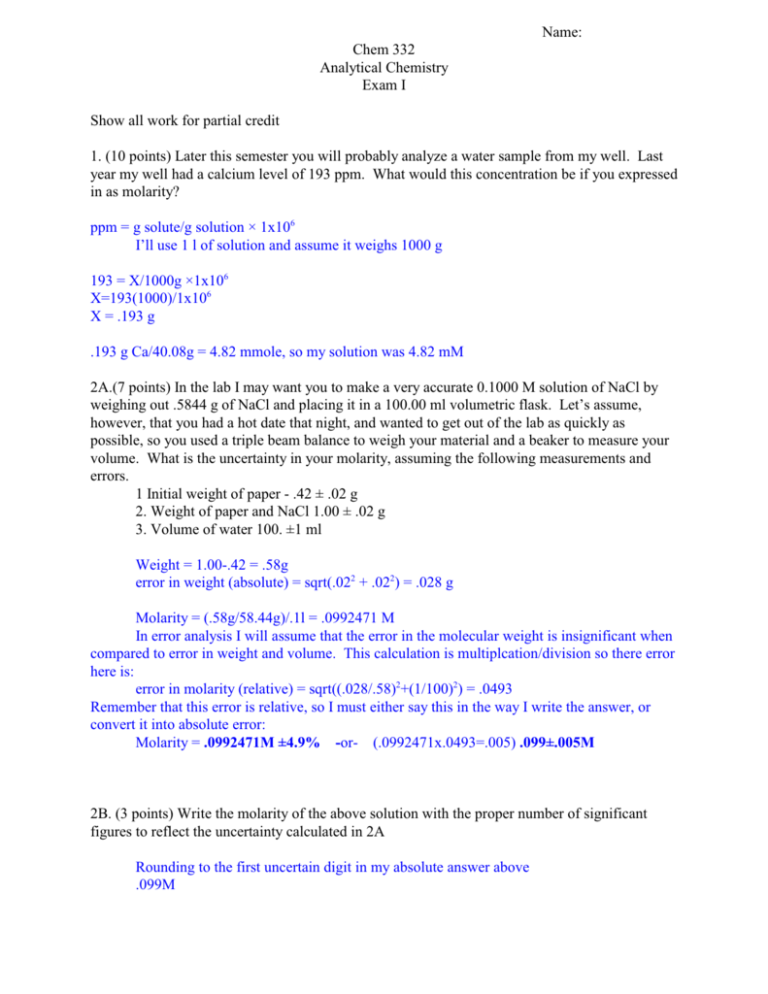
Name: Chem 332 Analytical Chemistry Exam I Show all work for partial credit 1. (10 points) Later this semester you will probably analyze a water sample from my well. Last year my well had a calcium level of 193 ppm. What would this concentration be if you expressed in as molarity? ppm = g solute/g solution × 1x10⁶ I’ll use 1 l of solution and assume it weighs 1000 g 193 = X/1000g ×1x106 X=193(1000)/1x106 X = .193 g .193 g Ca/40.08g = 4.82 mmole, so my solution was 4.82 mM 2A.(7 points) In the lab I may want you to make a very accurate 0.1000 M solution of NaCl by weighing out .5844 g of NaCl and placing it in a 100.00 ml volumetric flask. Let’s assume, however, that you had a hot date that night, and wanted to get out of the lab as quickly as possible, so you used a triple beam balance to weigh your material and a beaker to measure your volume. What is the uncertainty in your molarity, assuming the following measurements and errors. 1 Initial weight of paper - .42 ± .02 g 2. Weight of paper and NaCl 1.00 ± .02 g 3. Volume of water 100. ±1 ml Weight = 1.00-.42 = .58g error in weight (absolute) = sqrt(.022 + .022) = .028 g Molarity = (.58g/58.44g)/.1l = .0992471 M In error analysis I will assume that the error in the molecular weight is insignificant when compared to error in weight and volume. This calculation is multiplcation/division so there error here is: error in molarity (relative) = sqrt((.028/.58)2+(1/100)2) = .0493 Remember that this error is relative, so I must either say this in the way I write the answer, or convert it into absolute error: Molarity = .0992471M ±4.9% -or- (.0992471x.0493=.005) .099±.005M 2B. (3 points) Write the molarity of the above solution with the proper number of significant figures to reflect the uncertainty calculated in 2A Rounding to the first uncertain digit in my absolute answer above .099M 3. (10 points) Define or give a mathematical equation for the following terms: 1. Accuracy: How close you are to the actual value. 2. Precision: How close together your answer are. 3. Determinate error: Error that is unidirectional and reproducible. 4. Absolute uncertainty: Error that is recorded in the same units as the measurment itself. 5. Mode (of a distribution): The value that occur the most often in a set of data. 6. A Gaussian distribution: A ‘normal’ distribution that follows the standard bell shaped curve. 7. Method of Least squares: A method of fitting a line to a set of data that minimizes the sum of the squares of the deviations of the points from the line in the Y dimension. 8. Degrees of Freedom: Usually the number of data point -1. 9. A Primary Standard: A chemical that is of sufficient purity and stability that it can be weighed and used directly in an analytical procedure without further standardization. 10. A back titration: A titration method in which a known excess of titrant is added to an analyte, and then the excess titrant is determined . The difference between the known amount of titrant, and the amount of titrant that remains is then used to determine that amount of analyte. 4. (10 points) How many millileters of 0.100M KI are needed to react with 40.00 ml of 0.0400 M Hg2(NO3) if the reaction is: Hg22+ + 2I- 6 Hg2I2(s) ? 40 ml ×.04M Hg2(NO3) = 1.6 mmole Hg2(NO3) = 1.6 mmoles Hg22+ 1.6 mmoles Hg22+ x 2 mole I-/1 mole Hg22+ = 3.2 mmole IMolarity= mole/liter; .10000 = 3.2mmole/V; V=3.2 mmole/.1 = 32 mL KI 5A. (10 points) In the lab I get the following 4 numbers for the concentration of chloride in a sample: 0.1015, 0.0991, 0.1016, and 0.1017. What is the mean, the 95% confidence interval, and the relative standard deviation for this data set. Mean = .100975 s= 1.25×10⁻³ C.I. = mean ±s(t)/sqrt(n) = .100975 ±3.182(1.25×10⁻³)/sqrt(4) = .101±.002 5B (6 points). In 5A there is one value that looks like a ringer. Calculate Q for this one bad value and determine if it can be rejected from the date set . Q = gap/range = (.1015-.0991)/(.1017-.0991) = .92 Qtable = .76; Qcalc>Qtable, bad value may be rejected 5C (4 points) In 5A I had you calculate a relative standard deviation. I usually regard the relative standard deviation as a measure of the relative error on your mean. You also calculated a confidence interval, which is also a measure of the uncertainty of the mean. Compare and contrast these numbers. Which is the better measure of experimental uncertainty? The confidence interval is a much better indicator of the relative error in my mean because is includes two additional factors. First using the t statistics, I can state the explicit chance of error in my mean value; ie, there is a 90% (or 95%) chance that the mean is in this range. Second, because the C.I. calculation includes the number of samples, my range increases with a few sample and decreases when I have many samples, so my confidence interval gives an estimate of range that reflects the number of data points that I worked with. Take home portion 1. 20 points. Below is a set of data for a calibration curve of I used last year to correlate [Ca] concentration with a reading on an atomic emission machine. At the end of this experiment I tested my household tap water and got the reading shown. Using as much of this data as you want, what is the concentration of Ca in my tap water, and what is the uncertainty in this number. Include a complete spreadsheet for your analysis and state what assumptions or adjustments you had to make to come up with your final number [Ca] ppm 493 370 247 123 0 MZ tap water Emission run 1 1.035 .905 .735 .512 0.0 Emission run 2 1.04 .91 .745 .526 .01 .790 .810 When you first plot this data, you should immediately see that something is wrong, either the data is strongly curved or the zero point should be eliminated. Since we haven’t talked about how to handle curved data, the easiest fix it to eliminate the zero point and try again Original data Remove first point After removing the first point, now you can plug the data in to you least squares routine and get: Line of Best fit spreadsheet Line of Best fit n x y 1 493 1 493 1 370 1 370 1 247 1 247 1 123 1 123 sum s 8 2466 D= 1216236 Errors from line n x y 1 493 1 370 1 247 1 123 1 123 1 247 1 370 1 493 xy x^2 1.035 1.04 0.905 0.91 0.735 0.745 0.512 0.526 510.255 512.72 334.85 336.7 181.545 184.015 62.976 64.698 243049 243049 136900 136900 61009 61009 15129 15129 6.408 2187.759 912174 m= 0.001398 1.035 0.905 0.735 0.512 0.526 0.745 0.91 1.04 b= 0.370156 Y predict Deviation dev^2 1.059227 -0.02423 0.000587 0.887309 0.017691 0.000313 0.71539 0.01961 0.000385 0.542074 -0.03007 0.000904 0.542074 -0.01607 0.000258 0.71539 0.02961 0.000877 0.887309 0.022691 0.000515 1.059227 -0.01923 0.00037 Sum sy 0.026485 Predictio n Measured Y 0.81 s m 6.79E-05 Derived X 314.6891 0.004209 s b 0.022936 Uncertainty in X 20.10048 Using this analysis for a measured Y of .790 I get x = 300±20 , and .810 x=310±20 so I would call my result 305 ±20 ppm 2. (20 points) I am going to mix 50 ml of a solution that is saturated in PbI2 with 10 ml of a .5M KI solution. What is the final concentration of I- and Pb+2 in this solution? (Show all calculations. If you had to use the solver function on your calculator, state the equation that you used. If you make any assumptions, state the assumptions that you used and prove they are good.) This is a common ion problem. We have a solution that is saturated in PbI2, and we add a second solution that has a much higher concentration of the common ion I-. Since this common ion is a product in the solubility reaction, Le Chatlier’s principle says that the reaction will be pushed toward the reactants, and even more PbI2 will come out of solution. Since you are mixing two solutions together, you first have to come up with the concentraton of the ions in the individual solutions, and then see how this changes due to the simple mixing and dilution of one solution into the other The KI solution is easy [I-] = .5 Now let’s find the concentration of Pb and I in the saturated PbI2 solution Ksp = 7.9x10-9 = [Pb+2][I-]2 If [Pb+2] = X, [I-] = 2X, so -9 7.9x10 = X(2X)2 = 4X3; X=1/3 root of 7.9x10⁻⁹/4 = 1.25x10⁻³ M Pb+2 = 1.25x10⁻³ M I- =2.50x10⁻³ M Now I am going to mix 50 mls of this solution with 10 ml of a .5M KI solution. This is not a simple dilution problem because both solutions contain I-, so the best answer is to calculate the moles of I- in each solution and then divide by the total volume I- (50 ml) .05R×2.5x10-3M = 1.25x10⁻⁴moles (10 ml) .01R×.5M =.005moles (.005+1.24x10⁻⁴)mole/.06R = .0854M Pb+2 Since the only one solution has Pb+2 you can apply the dilution equation here : (M1V1=M2V2) 50(1.25x10⁻³)=X(60); X = 1.046x10⁻³M Now for the rest of the problem The quick and dirty answer The Ksp equation is 7.9x10-9 = [Pb+2][Cl-]2 1. We are going to solve for X, the amount of Pb+2 in solution. 2. Since we are adding an excess of I-, let’s assume that I- isn’t going to change much , so call Pb+2 = X and I- = .0854 Ksp = 7.9x10-9 = (X)(.0854)2 Y = 7.9x10⁻⁹ /.08542 = 1.08x10-6 = [Pb+2]( bit off from the exact) The exact answer Your reaction table should look like this: Pb+2 Before reaction 1.046x10⁻³ After reaction where x of PbI forms 1.046x10⁻³-X I.0854 PbI 0 .0854-2X X Using the above in the Ksp 7.9x10-9 = (1.046x10⁻³-X)(.0854-2X)2 plug into solver and you find that X = .0010389M so Pb+2 = .001046-.0010389 = 7.1x10⁻⁶ I- = .0854-2(.0010389) = .0833 Note that this is a bit off from the quick and dirty solution, and there are ways to massage the Q&D answer to get here, essentially by going through successive approximations, but since you didn’t have successive approximations at the time of the test, I didn’t worry about it.
