Evaluating x vs t graphs » Form A (Master Copy)
Directions: Please choose the best answer choice for each of the following questions.
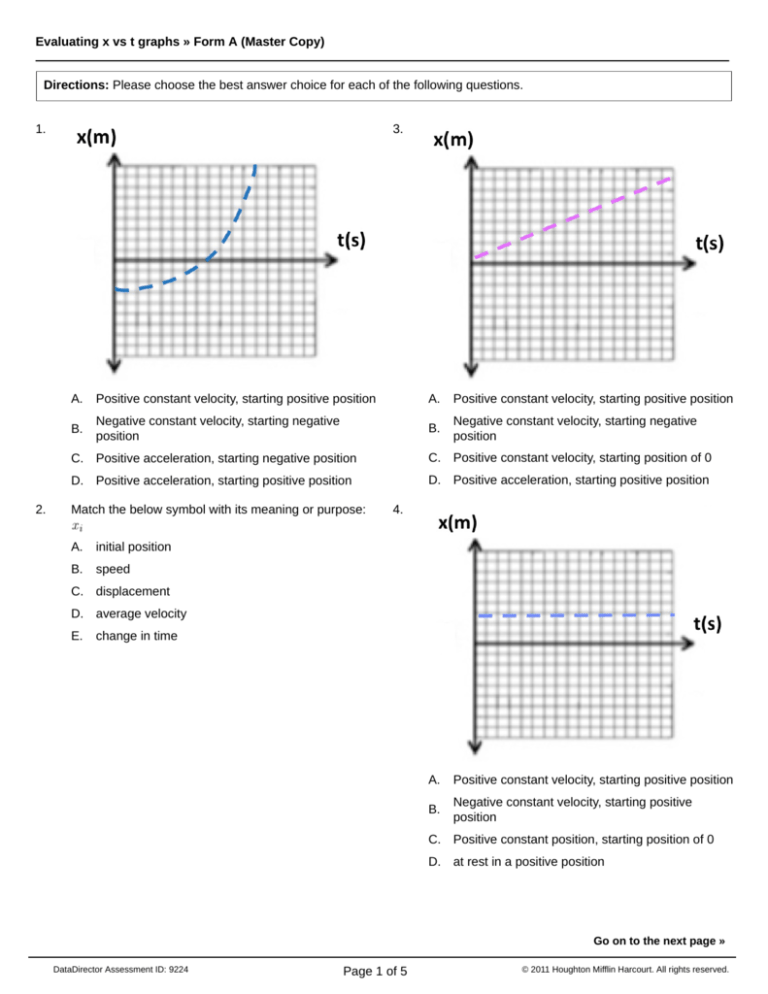
1.
2.
3.
A.
Positive constant velocity, starting positive position
A.
Positive constant velocity, starting positive position
B.
Negative constant velocity, starting negative
position
B.
Negative constant velocity, starting negative
position
C. Positive acceleration, starting negative position
C. Positive constant velocity, starting position of 0
D. Positive acceleration, starting positive position
D. Positive acceleration, starting positive position
Match the below symbol with its meaning or purpose:
A.
initial position
B.
speed
4.
C. displacement
D. average velocity
E.
change in time
A.
Positive constant velocity, starting positive position
B.
Negative constant velocity, starting positive
position
C. Positive constant position, starting position of 0
D. at rest in a positive position
Go on to the next page »
DataDirector Assessment ID: 9224
Page 1 of 5
© 2011 Houghton Mifflin Harcourt. All rights reserved.
Evaluating x vs t graphs » Form A (Master Copy)
5.
7.
A.
Positive velocity, starting positive position
B.
Positive velocity, starting negative position
C. Negative velocity, starting positive position
A.
Positive constant velocity, starting positive position
B.
Negative constant velocity, starting positive
position
C. Positive constant position, starting position of 0
D. Negative velocity, starting negative position
D. at rest in a positive position
6.
A.
Positive constant velocity, starting positive position
B.
Negative constant velocity, starting positive
position
C. Positive constant position, starting position of 0
D. at rest in a positive position
Go on to the next page »
DataDirector Assessment ID: 9224
Page 2 of 5
© 2011 Houghton Mifflin Harcourt. All rights reserved.
Evaluating x vs t graphs » Form A (Master Copy)
8.
9.
The diagram shows a ball rolling across the floor.
Which graph would represent the ball if it were
moving at a constant velocity in a positive
direction?
A.
The graphs shown above show the position, velocity
and acceleration of an object. Select the statement
that describes the motion shown by these graphs.
A.
The object's acceleration is negative..
B.
The object's velocity is positive.
C. The object's velocity is negative.
D. The object's position is constant.
B.
C.
Go on to the next page »
DataDirector Assessment ID: 9224
Page 3 of 5
© 2011 Houghton Mifflin Harcourt. All rights reserved.
Evaluating x vs t graphs » Form A (Master Copy)
10.
The blue line in the picture shows the path that Al
followed from home to school. If he arrived at school in
7 seconds after he left home, which of the following is
true about Al's average speed?
11.
Which graph represents motion with constant
nonzero acceleration?
A.
B.
A.
greater than 10 m/s
B.
less than10 m/s
C. equal to 10 m/s
C.
D.
Go on to the next page »
DataDirector Assessment ID: 9224
Page 4 of 5
© 2011 Houghton Mifflin Harcourt. All rights reserved.
Evaluating x vs t graphs » Form A (Master Copy)
12.
The blue line in the picture shows the path that Al
followed from home to school. If he arrived at school in
7 seconds after he left home, which of the following is
true about Al's average velocity?
15.
A physics book states that a car 'accelerates'. Based
on your knowledge of physics, you know that the car
must be:
A.
speeding up.
B.
speeding up or slowing down.
C. speeding up or slowing down along a straight line.
D.
16.
speeding up or slowing down or following a curved
path.
Mass is measured in:
A.
kilograms.
B.
pounds,
C. newtons.
D. ounces.
17.
Acceleration is measured in:
A.
miles per hour.
B.
meters per second.
C. newtons.
D. meters/second/second.
18.
A.
hours.
minutes.
A.
greater than 10 m/s
B.
B.
less than10 m/s
C. seconds.
D. days.
C. equal to 10 m/s
13.
The S.I. unit for Time is:
The length of the straight line between the starting and
ending point of an object's motion is also known as
the:
A.
path.
B.
distance.
19.
The S.I. unit for Velocity is:
A.
miles per hour.
B.
meters per second.
C. feet / hour.
D. meters/second/second.
C. displacement.
D. trajectory.
14.
Velocity is
A.
V = ∆x / ∆t
B.
V = ∆t / ∆x
C. V = ∆v / ∆t
D. V = ∆x / ∆v
Stop! You Go
have
onfinished
to the next
thispage
exam.
»
DataDirector Assessment ID: 9224
Page 5 of 5
© 2011 Houghton Mifflin Harcourt. All rights reserved.


