Analysis of changes in the Period of a Pendulum
Analysis of changes in the Period of a Pendulum
Problem: How does the period of a pendulum change when the __________ is changed?
(mass, length, angle)
Hypothesis: If the _______________ is increased, then the period will ______________.
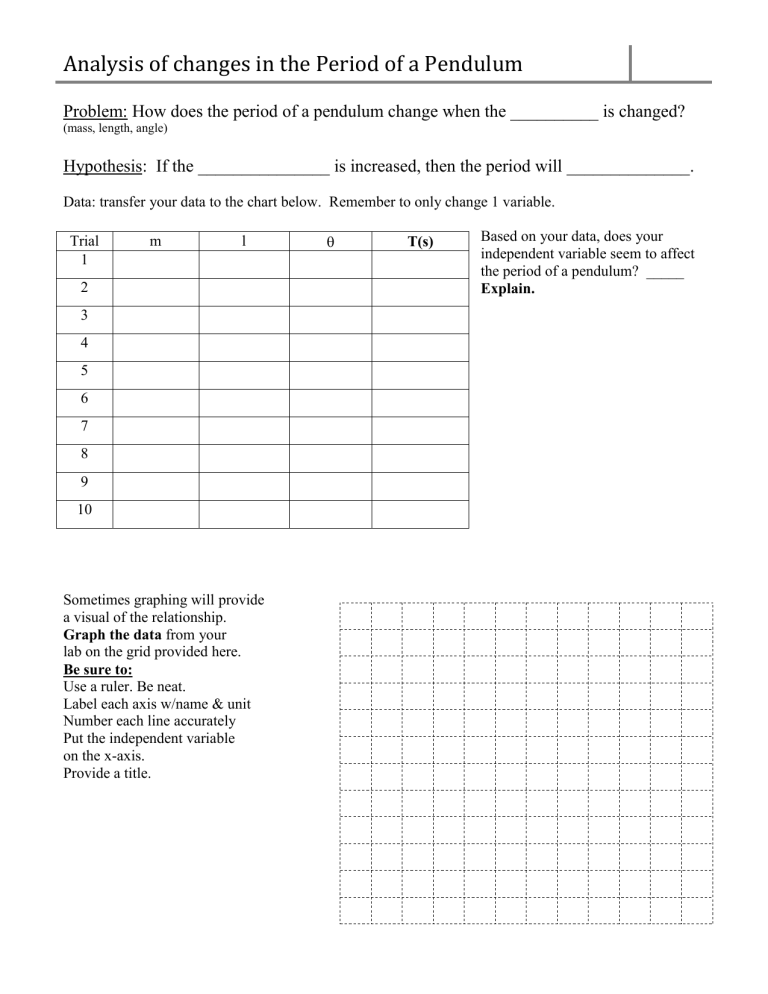
Data: transfer your data to the chart below. Remember to only change 1 variable.
Trial
1 m l
T(s)
Based on your data, does your independent variable seem to affect the period of a pendulum? _____
2 Explain.
3
4
5
6
7
8
9
10
Sometimes graphing will provide a visual of the relationship.
Graph the data from your lab on the grid provided here.
Be sure to:
Use a ruler. Be neat.
Label each axis w/name & unit
Number each line accurately
Put the independent variable on the x-axis.
Provide a title.
Analysis of changes in the Period of a Pendulum
ANALYSIS FOLLOWING GROUP SHARING:
Variable Tested________________________
Number of students showing increase in time______________
Number of students showing decrease in time _____________
Number of students showing no change in time ____________
YOUR GROUP CONCLUSION:
As the _________________________ is increased the period _________________________.
WAIT FOR SHARING FROM ALL 3 GROUPS BEFORE ANSWERING BELOW
Which factor(s) did not seem to affect the period of the pendulum? ______________________________
Which factor(s) seem to have affected the period of the pendulum? _______________________________
Look at your hypothesis. Were you correct? Write a conclusion paragraph summarizing your discoveries. In your conclusion refer to your original hypothesis, specific data and your graph. Also offer suggestions for taking the investigation a step further.
DATA OBTAINED FROM http://phet.colorado.edu/en/simulation/pendulum-lab
