Graphing Demand and Supply curves on the same axes
advertisement
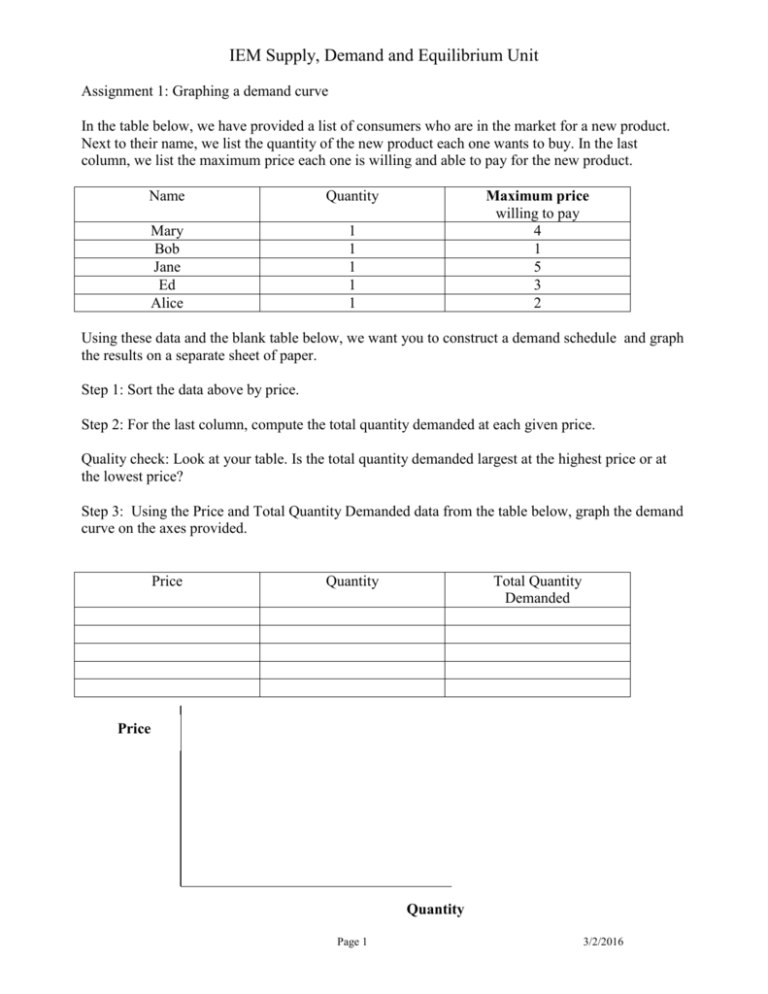
IEM Supply, Demand and Equilibrium Unit Assignment 1: Graphing a demand curve In the table below, we have provided a list of consumers who are in the market for a new product. Next to their name, we list the quantity of the new product each one wants to buy. In the last column, we list the maximum price each one is willing and able to pay for the new product. Name Quantity Mary Bob Jane Ed Alice 1 1 1 1 1 Maximum price willing to pay 4 1 5 3 2 Using these data and the blank table below, we want you to construct a demand schedule and graph the results on a separate sheet of paper. Step 1: Sort the data above by price. Step 2: For the last column, compute the total quantity demanded at each given price. Quality check: Look at your table. Is the total quantity demanded largest at the highest price or at the lowest price? Step 3: Using the Price and Total Quantity Demanded data from the table below, graph the demand curve on the axes provided. Price Quantity Total Quantity Demanded Price Quantity Page 1 3/2/2016 IEM Supply, Demand and Equilibrium Unit Assignment 2: Graphing a demand curve using real data In the spreadsheet Bradley_demand, you are provided with data on prices and quantity demanded for a number of individuals interested in buying a political futures contract in the fall of 1999. This contract pay $1 if Bill Bradley is the Democratic nominee for the election in 2000. It will pay $0 if he is not. Part 1: Following the same procedure as in Assignment 1, use Excel to construct a demand curve for the Bradley contract. (Is the quantity demanded highest at the lowest price?) Part 2: Using Excel, plot the data with the prices as the Y axis and the total quantity demanded as the Y axis. Use the Chart Wizard. This should be an X-Y chart (with lines). You may have to move the columns around to get the right axes. Part 3: In November 1999, Bill Bradley had a political rally in Madison Square Garden in New York City. Among the featured speakers were many current and former NBA players. Bill Bradley is a former professional basketball player himself. What effect do you think this political rally would have on the demand curve for Bradley contracts? Sketch (by hand) the new demand curve on the same graph from Part 2. Page 2 3/2/2016 IEM Supply, Demand and Equilibrium Unit Assignment 3: Graphing a supply curve In the table below, we have provided a list of companies who are willing to sell a new product. Next to their company name, we list the quantity of the new product each one is willing to sell. In the last column, we list the minimum price each one is willing accept for the new product. Name Quantity ADC SSW QWL YYJ AQD 1 1 1 1 1 Maximum price willing to pay 3 2 5 1 4 Using these data and the blank table below, we want you to construct a supply schedule and graph the results on a separate sheet of paper. Step 1: Sort the data above by price. Step 2: For the last column, compute the total quantity supplied at each given price. Quality check: Look at your table. Is the total quantity supplied largest at the highest price or at the lowest price? Step 3: Using the Price and Total Quantity Supplied data from the table below, graph the demand curve on the axes provided. Price Quantity Total Quantity Supplied Price Quantity Page 3 3/2/2016 IEM Supply, Demand and Equilibrium Unit Assignment 4: Graphing a supply curve using real data In the spreadsheet Bradley_supply, you are provided with data on prices and quantity willing to supply for a number of individuals interested in selling a political futures contract in the Fall of 1999. This contract pay $1 if Bill Bradley is the Democratic nominee for the election in 2000. It will pay $0 if he is not. Part 1: Following the same procedure as in Assignment 1, use Excel to construct a supply curve for the Bradley contract. (Is the quantity supplied highest at the highest price?) Part 2: Using Excel, plot the data with the prices as the Y axis and the total quantity supplied as the Y axis. Use the Chart Wizard. This should be an X-Y chart (with lines). You may have to move the columns around to get the right axes. Part 3: Assume these contracts will be bought and sold over the internet. In November 1999, a number of politicians proposed taxing all transactions over the internet which would include the buying and selling of the Bradley political futures contract. If this tax were to go into effect immediately, what effect would there be on the supply curve for the Bradley contract? Sketch (by hand) the new supply curve on the same graph from Part 2. Page 4 3/2/2016 IEM Supply, Demand and Equilibrium Unit Assignment 5: Graphing Demand and Supply curves on the same axes Step 1: Using the data from Assignments 1 and 3, determine the total quantity demanded and the total quantity supplied at each price level. Enter the results in the table below. Quality check: Look at your table. Is the total quantity demanded (supplied) largest at the lowest (highest) price? Price Total Quantity Demanded Total Quantity Supplied Step 2: Using the Price, Total Quantity Demanded and Total Quantity Supplied data from the table below, graph the demand and supply curves on the axes provided. Price Quantity Page 5 3/2/2016 IEM Supply, Demand and Equilibrium Unit Assignment 6: Market equilibrium using the Bradley contract demand and supply data Using the demand curve and supply curve data from Assignments 2 and 4, copy the price and total quantity demanded (supplied) columns to a new spreadsheet. You should have four columns: price and total quantity demanded (sorted with price ascending and quantity descending), price and total quantity supplied (sorted with price ascending and quantity ascending). Sort the price and quantity demanded data so that total quantity demanded is ascending. You should be able to tell at this point how many contracts were sold in the market and at what prices. (Tip: How much did the first contract sell for? How much did the suppliers want in order to supply 2 contracts?) What is the equilibrium quantity in this market? What is the equilibrium price in this market? Page 6 3/2/2016 IEM Supply, Demand and Equilibrium Unit Assignment 7: Observing and Predicting Prices in the IEM Choose one of the current markets running at the IEM Read the prospectus to make sure you understand how the contracts work Using various news sources, try to determine what events will affect prices in the IEM for twoweeks Using your understanding of supply and demand, predict how prices should change Determine if your predictions were correct and reconcile any discrepancies Page 7 3/2/2016
