View This File
advertisement
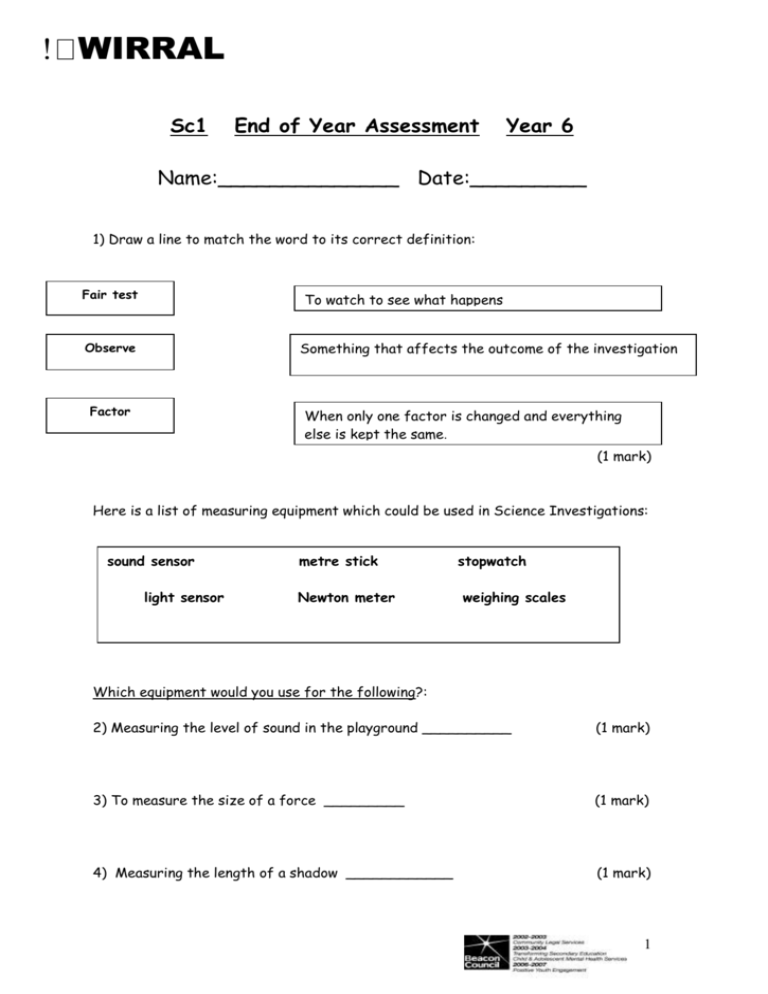
WIRRAL Sc1 End of Year Assessment Year 6 Name:______________ Date:_________ 1) Draw a line to match the word to its correct definition: Fair test To watch to see what happens Observe Something that affects the outcome of the investigation Factor When only one factor is changed and everything else is kept the same. (1 mark) Here is a list of measuring equipment which could be used in Science Investigations: sound sensor light sensor metre stick Newton meter stopwatch weighing scales Which equipment would you use for the following?: 2) Measuring the level of sound in the playground __________ (1 mark) 3) To measure the size of a force _________ (1 mark) 4) Measuring the length of a shadow ____________ (1 mark) 1 Year 6 children were investigating how the angle of the ramp affected the distance a toy car would travel down it. They carried out the investigations 3 times and then found the average result. Angle of ramp Distance travelled by toy car (cm) 1st attempt 10 degrees 20 degrees 30 degrees 40 degrees 50 degrees 60 degrees 1st attempt 21 34 50 62 75 88 2nd attempt 19 30 51 64 73 86 3rd attempt 20 32 49 66 77 90 5) Why did the children carry out the investigation 3 times? ___________________________________________________ Average distance the car travelled(cm) 20 32 50 64 75 88 (1 mark) 6) What was the average distance the toy travelled when the angle of the ramp was 40 degrees? _________ (1 mark) 7) Using the data from the table above plot the missing points for 30, 40 and 50 degrees on the graph below. (2 marks) Distance travelled in cm Title - A graph to show how the angle of the ramp affected the distance the toy car travelled. 120 100 80 60 40 20 0 0 10 20 30 40 50 60 70 Angle of ramp (degrees) Choose one of the following words to complete the sentence below: flatter smaller steeper stronger 8) The ____________the ramp the further the toy travelled. (1 mark) 9) Instead of measuring in cm how could the children be more accurate next time? (1 mark) 2 A class was investigating how puddles evaporate. They worked in two groups. The first group measured the diameter of a puddle in a sunny side of the playground throughout the day. The other group measured the diameter of the puddle in a shady part of the playground. The results are shown in the line graph below. 10) Label each line on the graph either SUNNY or SHADY area (1 mark) Diameter of puddle (cm) A line graph to show the rate of evaporation of puddles in different areas of the playground. 50 45 40 35 30 25 20 15 10 5 0 1 2 3 4 5 6 7 Time taken (hours) 11) Choose which equipment you would use to measure the size (diameter) of the puddle. Tick one box: (1 mark) Newton meter metre stick light sensor 12a) In which area did the puddle completely evaporate? ________ (1 mark) b) How long did the puddle take to evaporate completely? _______ (1 mark) 13) Can you think of a different factor that could speed up the rate of the puddle evaporating? (1 mark) 3 14) Three children were examining different types of materials The cling film is transparent The card is opaque The tissue paper is translucent What type of statements have the children made? Tick one box: prediction a measurement plan an observation (1 mark) Class 12 were investigating how high a tennis ball bounced when dropped from different heights. Their results are shown in the table below: Height of drop (cm) 50 100 150 200 Height of bounce (cm) 30 62 88 115 15) What is the ONE factor they changed during their investigation? ________________________________________ (1 mark) 16) Describe how the height of the drop affected the height the ball bounced? (2 marks) 17) Think of another investigation that could affect how high the tennis ball would bounce. What factor will you change as you carry out your new investigation? (1 mark) 4 The head teacher was upset because the tea machine did not dissolve sugar fast enough. She often wondered what factors were to blame for this problem! Plan an investigation to find out how the sugar could dissolve faster. 18) My question is Use your question to help you answer the questions below. (1 mark) 19) What ONE factor should you plan to change as you carry out your investigation? _________________________________ (1 mark) 20) Write ONE factor you should keep the same to make your test fair. _________________________________ (1 mark) 21) Which factor will you observe or measure to collect your results? ____________________________________________ (1 mark) TOTAL = 24 marks 5 WIRRAL Sc1 End of Year Assessment Answers Year 6 1) fair test – when only one factor is changed and everything else is kept the same observe – to watch and see what happens factor – something that affects the outcome of an investigation (all matched correctly for 1 mark) 2) sound sensor (1 mark) 3) Newton metre (1 mark) 4) metre stick (1 mark) 5) To check their results /are reliable / reliability (1 mark) 6) 64 cm (1 mark) 7) All 3 points plotted for 2 marks, 2 points plotted for 1 mark (2 marks) Distance travelled in cm Title - A graph to show how the angle of the ramp affected the distance the a wheel travelled. 120 100 80 60 40 20 0 0 10 20 30 40 50 60 70 Angle of ramp (degrees) 8) The steeper the ramp the further the wheel travelled (1 mark) 9) mm (1 mark) 10) Diameter of puddle (cm) A line graph to show the rate of evaporation of puddles in different areas of the playground. 50 45 40 35 30 25 20 15 10 5 0 shady sunny 1 2 3 4 5 6 7 Time taken (hours) (both labelled correctly for 1 mark) 6 11) metre stick ( 1 mark) 12a) Sunny (1 mark) b) 7 hours (1 mark) 13) Wind or any suitable factor mentioned (1 mark) 14) Observation (1 mark) 15) height of the drop (1 mark) 16) The higher the drop the higher the bounce OR the lower the drop the lower the bounce. (comparison has to be made for 2 marks) ONE mark can be awarded for the highest drop bounces highest, or the lowest drop bounces lowest 17) any other suitable factor to change e.g surface, etc (1 mark) 18) Any of the following / suitable questions: Does the type of sugar affect the rate of dissolving? Does the number of stirs affect the rate of dissolving? Does the temperature of the water affect the rate of dissolving? Does the size/ type of the cup affect the rate of dissolving? (1 mark) 19) POSSIBLE FACTORS TO CHANGE – types of sugar, number of stirs, speed of stirring, temperature of water, amount of water, type of cup / material / size (depends on investigation) etc. (1 mark) 20) POSSIBLE FACTORS TO KEEP THE SAME – e.g. temp of water, cups, amount of water, same rate of stirring (depends on factor changing) (1 mark) 21) time taken for sugar to dissolve (1 mark) (out of 24 marks) 7 8
