Scientific notation and significant figures A number such as 6378
advertisement
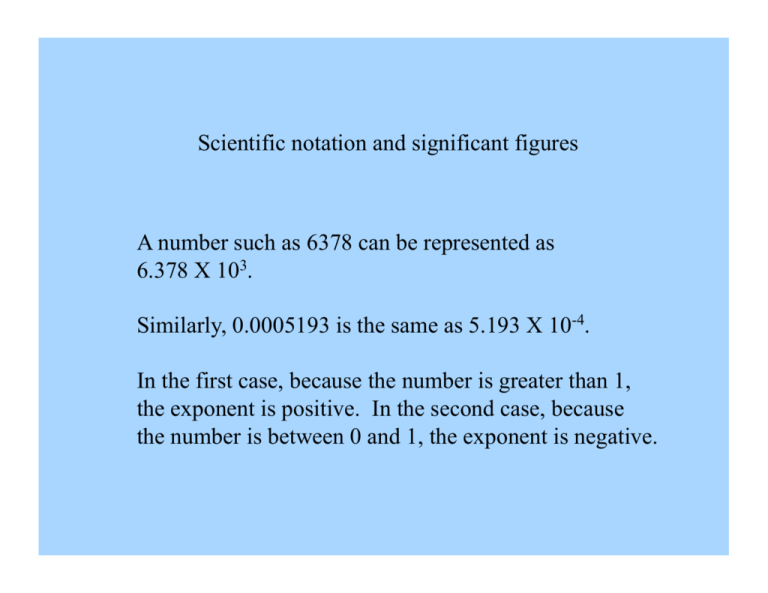
Scientific notation and significant figures A number such as 6378 can be represented as 6.378 X 10³. Similarly, 0.0005193 is the same as 5.193 X 10⁻⁴. In the first case, because the number is greater than 1, the exponent is positive. In the second case, because the number is between 0 and 1, the exponent is negative. A number represented in scientific notation is of the form n.nnnn X 10A 7.553 X 10² is the same as 755.3. The exponent of “2” means that you move the decimal point two places to the right to write the number in regular notation. Similarly, 1.234 X 10-2 = 0.01234. The decimal point of “1.234” is moved two places to the left because the exponent is negative. For a number in scientific notation represented as n.nnnn X 10A the digits “n” aren't necessarily the same number, but the fact that there are 5 of them means that a number such as 2.9979 X 10⁸ has 5 significant figures. A number such as 3.00 X 10⁸ has only 3 significant figures, and therefore has less precision. When multiplying or dividing two numbers, the accuracy of the result depends on the accuracy of the two numbers. The result cannot have more significant digits than the less accurate number. For example, 6.378 X 103 times 1.123 X 10-3 is best represented as 7.162 rather than as 7.162494. Similarly, 6.378169 times 1.1 is best represented as 7.0 instead of what your calculator might tell you. Numbers such as π = 3.14159265358979.... have essentially an infinite number of significant figures because they are mathematical constants. 6.7 / π will have a different number of significant figures than 6.70000 / π because the numerator in the first case has less precision than in the second case. Errors of Measurement The modern theory of statistics owes a lot to the German mathematician, physicist, and astronomer Carl Friedrich Gauss (1777-1855). You all have heard of the “bell-shaped curve” or Normal distribution. If you make many measurements of some quantity there will be some average value and the values will exhibit a distribution about the mean as follows: The width of the curve at half its height is +/one “standard deviation”. Consider the number 625.0 +/- 12.5. The standard deviation of 12.5 means that 68.3% of the values fall between 625.0 – 12.5 = 612.5 and 625.0 + 12.5 = 637.5 95% of the measurements are between +/- 2 standard deviations of the mean value. 99% of the measurements are between +/- 3 standard deviations of the mean. Imagine a political poll conducted in 2012 involved 1000 registered voters. Say 42 percent preferred Newt Gingrich, while 46 percent preferred Barak Obama, and there were 12 percent undecided. You would likely have been told that the uncertainty of these numbers is +/- 3 percentage points. Where does the +/- 3 % come from? It turns out that it's simply 1/sqrt(1000), or the square root of the reciprocal of the number of voters asked for a preference. Now say an astronomer is using a telescope to measure the brightness of a distant quasar. If 1000 photons attributable to the quasar are counted, how accurately can you say you have measured the brightness of the quasar? It turns out that it's the same relative error as in the political poll: 1/sqrt(1000) ~ 3 percent. In order to measure the brightness of the quasar to +/- 1 percent you need to measure 10,000 photons, so your integration time has to be 10 times as long, or you need to use a telescope with a collecting area 10 times as big. If we took an opinion poll consisting of fair minded questions and we wanted the results to be good to +/- 1 percent, how many people would we have to poll in our survey? A. B. C. D. 100 1000 10,000 100,000

