Chapter 3: Statistics
advertisement

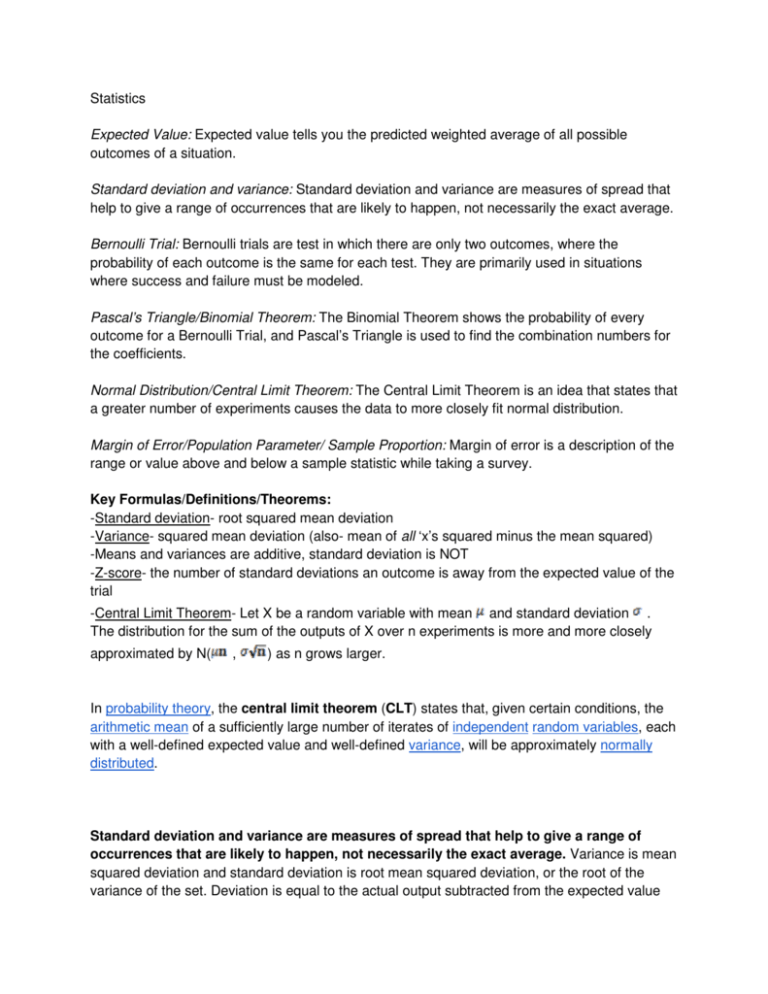
Statistics Expected Value: Expected value tells you the predicted weighted average of all possible outcomes of a situation. Standard deviation and variance: Standard deviation and variance are measures of spread that help to give a range of occurrences that are likely to happen, not necessarily the exact average. Bernoulli Trial: Bernoulli trials are test in which there are only two outcomes, where the probability of each outcome is the same for each test. They are primarily used in situations where success and failure must be modeled. Pascal’s Triangle/Binomial Theorem: The Binomial Theorem shows the probability of every outcome for a Bernoulli Trial, and Pascal’s Triangle is used to find the combination numbers for the coefficients. Normal Distribution/Central Limit Theorem: The Central Limit Theorem is an idea that states that a greater number of experiments causes the data to more closely fit normal distribution. Margin of Error/Population Parameter/ Sample Proportion: Margin of error is a description of the range or value above and below a sample statistic while taking a survey. Key Formulas/Definitions/Theorems: -Standard deviation- root squared mean deviation -Variance- squared mean deviation (also- mean of all ‘x’s squared minus the mean squared) -Means and variances are additive, standard deviation is NOT -Z-score- the number of standard deviations an outcome is away from the expected value of the trial -Central Limit Theorem- Let X be a random variable with mean and standard deviation . The distribution for the sum of the outputs of X over n experiments is more and more closely approximated by N( , ) as n grows larger. In probability theory, the central limit theorem (CLT) states that, given certain conditions, the arithmetic mean of a sufficiently large number of iterates of independent random variables, each with a well-defined expected value and well-defined variance, will be approximately normally distributed. Standard deviation and variance are measures of spread that help to give a range of occurrences that are likely to happen, not necessarily the exact average. Variance is mean squared deviation and standard deviation is root mean squared deviation, or the root of the variance of the set. Deviation is equal to the actual output subtracted from the expected value (making it able to be positive, negative, or zero). If two independent random variable results are added together to form a new random variable, the resulting variance and mean are the sums of the two previous ones. An outcome’s z-score is the number of standard deviations away from the expected value it is. Bernoulli trials are test in which there are only two outcomes, where the probability of each outcome is the same for each test. They are primarily used in situations where success and failure must be modeled. Often, success is assigned the value 1 and failure is given the value 0. For a Bernoulli trial with a given probability p, the probability of failure is 1-p. Then, for any number of trials n, the mean will be np. To find variance, the mean squared deviation, we take the deviation from the mean for each outcome. When the success value is 1, the deviation is 1p. The deviation squared is (1-p)^2. For a failure, 0, the deviation is -p. The deviation squared is p^2. Multiplying each squared deviation by the probability of the outcome gives p(1-p)^2 and p^2(1-p). Adding these values reduces to p(1-p). Since variance is additive, the variance of n trials is np(1-p). The standard deviation of a series of trials is simply (root(np(1-p))). Margin of error is a description of the range or value above and below a sample statistic while taking a survey. In every survey, the distribution will not be exactly as the average should be, and finding the % margin of error tests how accurate the study is in terms of a real-world standpoint. EXPECTED VALUE by JaKob Laats Expected value tells you the predicted weighted average of all possible outcomes of a situation. The expected value is similar to the mean of a variable that could have any value. This means that if the same experiment was performed repeatedly the expected value would be the average of all the results. In real life situations, expected value can be applied to games of chance to see whether the game would overall be worth playing. To find the expected value of a scenario that has outcomes X1, X2....Xn with probabilities of these outcomes P1, P2...Pn the expected value would be X1xP1+X2xP2+...+XnxPn. Pascal’s Triangle and Binomial Theorem The Binomial Theorem shows the probability of every outcome for a Bernoulli Trial, and Pascal’s Triangle is used to find the combination numbers for the coefficients. The triangle can be produced by adding the sum of the two numbers above the desired value. The starting digits are: 1 11 121 1331 14641 1 5 10 10 5 1 1 6 15 20 15 6 1 1 7 21 35 35 21 7 1 These numbers can be used to find the probability of combinations. The number of combinations of n things taken from k at a time, called n choose k, can be found by looking at Pascal’s triangle. For example, if a basketball team has 6 players and wants to know how many ways there are of selecting 4 players, the 6th row, with the top of the triangle being row 0, and the left of each row being 0, then the solution and the position of the coordinates on the triangle are 15. In addition, the binomial theorem, which describes the algebraic expansion of powers of a binomial, can be found from Pascal’s triangle. For example, if there was an equation (x+y)^5, then the expansion would be x^5 + 5*x^4*y + 10*x^3*y^2 + 10*x^2*y^3 + 5*x*y^4 + y^5. The coefficients of this expansion are 1, 5, 10, 10, 5, and 1, which match the 5th row of Pascal’s triangle. Central Limit Theorem/Normal Distribution The Central Limit Theorem is an idea that states that a greater number of experiments causes the data to more closely fit normal distribution. The normal distribution of an experiment creates a bell-shaped graph. As an experiment is executed more times, the actual graph of the results will look more and more like the normal distribution graph. The notation for normal distribution , where represents the mean and represents the standard deviation. Another is N( aspect of the Central Limit Theorem is that the mean of a set of experiments gets closer and closer to the expected mean as more experiments are repeated. When a normal distribution has mean 0 and standard deviation 1 it is called unit normal distribution, and it can be used to measure probability. Thus, it has the properties that about 68% of the data of a set of experiments will lie within one standard deviation of the mean, about 95% within two standard deviations, and 99.7% within three standard deviations. PROBLEMS Bernoulli Trial: A coin that lands heads 60% of the time is flipped 1000 times. It ends up landing heads 611 times. Is this answer surprising? Solution: The variance for this coin is 1000*0.6*0.4=240. The standard deviation is then root 240 or 15.4919. The mean is 600 heads, so one would expect the answer to be within 600 +- 16. 611 is within that range, so this result is fairly typical. Normal Distribution Question: 95% of test scores are between 94 and 78. Assuming that the data is normally distributed, what are the mean and standard deviation? Answer: The mean is 86 because (94+78)/2=86 The standard deviation is 4 because (94-78)/4=4 Standard Deviation/Variance Question: Suppose you have a spinner with equal thirds labeled 1, 3, 6. You spin it 50 times and you get a sum of 200. How many z-scores away from the mean is this? Is it likely? Solution: The mean of this set is (1+3+6)/3, which is 3 ⅓. Because the mean can be added with repeated trials, the mean of spinning 50 times is 50*3 ⅓ which is 166 ⅔. The variance of one spin is the mean squared deviation which is (2 ⅓)^2 + (⅓)^2 + (2 ⅔)^2 all divided by 3 which comes out to be 4 2/9. Because the variance is also additive, the variance of spinning fifty times is 50 times that, 211 1/9. The standard deviation is a root of that which is about 14.5297. 200 is 33 ⅓ away from the mean and 33 ⅓ / 14.5297 is about 2.294. That means this is very unlikely, considering there is less than a 5% chance of getting 200. Expected Value Question: For $2 you roll a standard six sided die. If the number is a 6 you win $10, otherwise you win nothing. Is this game cost effective to play repeatedly? Solution: For this game 5/6 probability of winning -2 dollars and 1/6 chance of winning 8 dollars. Plug these values into equation above to get -2(5/6)+8(1/6)=-1/3 so on average the player of this game will lose 1/3 of a dollar because the expected value is -1/3. Pascal’s Triangle and Binomial Theorem Question: How would (x+y)^n be expanded? Solution: x^n + (1 choose n)*x^(n-1)*y + (2 choose n)*x^(n-2)*y^2 + (3 choose n)*x^(n-3)*y^3 + ... + ((n-2) choose n)*x^(n-(n-2))*y^(n-2) + ((n-1) choose n)*x^(n-(n-1))*y^(n-1) + y^n


