Lesson
11
Finding Common Denominators
Problem Solving:
Graphs With Two Lines
Finding Common Denominators
Vocabulary
How do we find common denominators?
common multiple
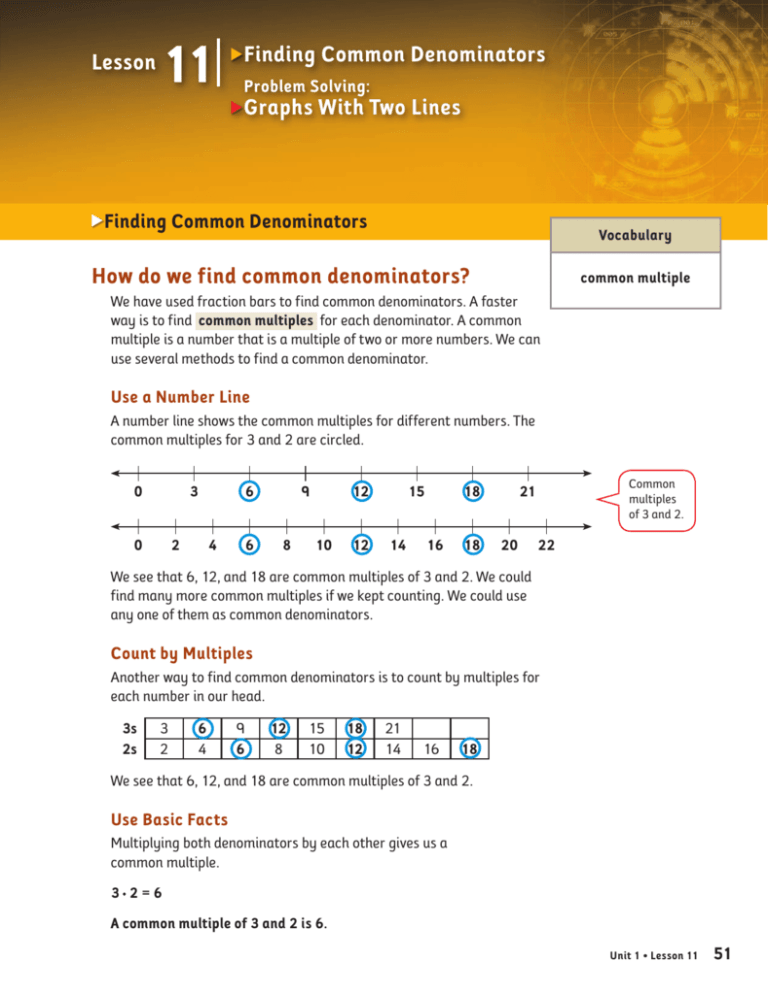
We have used fraction bars to find common denominators. A faster
way is to find common multiples for each denominator. A common
multiple is a number that is a multiple of two or more numbers. We can
use several methods to find a common denominator.
Use a Number Line
A number line shows the common multiples for different numbers. The
common multiples for 3 and 2 are circled.
0
3
0
2
6
4
6
9
8
12
10
12
15
14
18
16
18
Common
multiples
of 3 and 2.
21
20
22
We see that 6, 12, and 18 are common multiples of 3 and 2. We could
find many more common multiples if we kept counting. We could use
any one of them as common denominators.
Count by Multiples
Another way to find common denominators is to count by multiples for
each number in our head.
3s
2s
3
2
6
4
9
6
12
8
15
10
18
12
21
14
16
18
We see that 6, 12, and 18 are common multiples of 3 and 2.
Use Basic Facts
Multiplying both denominators by each other gives us a
common multiple.
3·2=6
A common multiple of 3 and 2 is 6.
Unit 1 • Lesson 11 51
Lesson 11
We must find a common multiple to make fractions that have the same
denominators.
Add 13 + 12 .
Steps for Making Common Denominators to Add Fractions
Step 1
Find a common denominator.
We know that 12 is a common multiple of both
2 and 3. We need to multiply each fraction by a
fraction equal to 1 to make both denominators 12.
We know that 3 · 4 = 12, and 2 · 6 = 12.
1 4
4
3 · 4 = 12
1 6
6
2 · 6 = 12
6
The fractions we use are 4
4 and 6 .
Step 2
Solve the problem.
4
6
10
12 + 12 = 12
We use the same steps when we subtract fractions with unlike
denominators.
1
Subtract 2
3 − 2.
Steps for Making Common Denominators to Subtract Fractions
Step 1
Find a common denominator.
We know that 12 is a common multiple of both
2 and 3. So we need to multiply each fraction by a
fraction equal to 1 to make both denominators 12.
We know that 3 · 4 = 12, and 2 · 6 = 12.
2 4
8
3 · 4 = 12
1 6
6
2 · 6 = 12
6
The fractions we use are 4
4 and 6 .
Step 2
Solve the problem.
52 Unit 1 • Lesson 11
8
6
2
12 − 12 = 12
Lesson 11
Let’s see how this works with other fractions.
Example 1
Add 14 and 2
6.
We need to find the common denominator. We know if we count up by
multiples, we can find a number that both 4 and 6 can go into.
The first number we come to that is a multiple of both 4 and 6 is 12.
3
We know that 4 goes into 12 three times, so we will multiply 1
4 by 3 .
2
We also know that 6 goes into 12 two times, so we will multiply 2
6 by 2 .
1 3
3
2 2
4
4 · 3 = 12 6 · 2 = 12
The answer is 132 + 142 = 172 .
Example 2
2
Subtract 6
7 − 3.
We need to find the common denominator. We know if we count
up by multiples, we can find a number that both 7 and 3 go into.
The first number we come to that is a multiple of both 7 and 3 is 21.
3
We know that 7 goes into 21 three times, so we will multiply 6
7 by 3 .
7
We also know that 3 goes into 21 seven times, so we will multiply 2
3 by 7 .
6 3 18
2 7 14
7 · 3 = 21 3 · 7 = 21
4
The answer is 1218 − 1214 = 21
.
Apply Skills
Reinforce Understanding
Turn to Interactive Text,
page 30.
Use the mBook Study Guide
to review lesson concepts.
Unit 1 • Lesson 11 53
Lesson 11
Problem Solving: Graphs With Two Lines
When do we use a graph with two lines?
We compare sets of data by using a line graph with more than one line.
Such line graphs show how two or more sets of data change over time.
The graph below shows what time the sun sets in two different cities
over a one-year period.
Sunsets in Seattle and San Diego
9:36 PM
8:24 PM
Seattle
Time of Day
7:12 PM
San Diego
6:00 PM
4:48 PM
3:36 PM
2:24 PM
1:12 PM
ly
Au
g.
Se
pt
.
Oc
t.
No
v.
De
c.
Ju
ne
Ju
ay
r.
M
Ap
ar
.
b.
M
Fe
Ja
n.
0:00 PM
Month
We see from the graph that in summer the sun sets later in Seattle than
in San Diego. We also see that the sun sets a little bit later in San Diego
than in Seattle during January.
Speaking of Math
Here’s how we can explain our thinking when we choose to use a
multiple-line graph.
• “I can compare sets of data.”
• “I can show how two or more sets of data change over time.”
• “I can compare similar data sets over the same time period.”
54 Problem-Solving Activity
Reinforce Understanding
Turn to Interactive Text,
page 31.
Use the mBook Study Guide
to review lesson concepts.
Unit 1 • Lesson 11
Lesson 11
Homework
Activity 1
Select the fraction that goes in the location shown on the number line.
Model
1
4
3
4
?
Is this fraction 13 , 12 , or 23 ?
1
2
1.
?
Is this fraction 23 , 24 , or 14 ? 2.
1
4
?
Is this fraction 34 , 32 , or 13 ? 1
2
1
4
3
4
2
3
1
3
Activity 2
Look at the number lines to help you solve the problems.
0
0
1.
1
3
+ 24
3
2
6
4
6
2
9
8
12
10
1
12
3
2. 3 − 4
15
14
18
16
1
3
3. 4 + 3
18
21
20
2
2
4. 4 − 3
3
5. 3 + 4
1
1
6. 3 + 4
Activity 3
Tell which of the problems can be solved without finding a common
denominator. Write the letter. (a)
1
3
+ 14
(b)
1
2
+ 12
(c)
2
3
+ 13
(d)
3
5
+ 25
Activity 4 • Distributed Practice
Solve.
1.
500
+ 800
1,300
2.
7,012
2,995
4,017
3.
68
79
5,372
4.
708
2
5. 8q597
1,416
Copyright 2010 by Cambium Learning Sopris West®. All rights reserved. Permission is granted to reproduce this page for student use.
Unit 1 • Lesson 11 55


