Physics Exam: String Frequency & Tension - Higher Level
advertisement
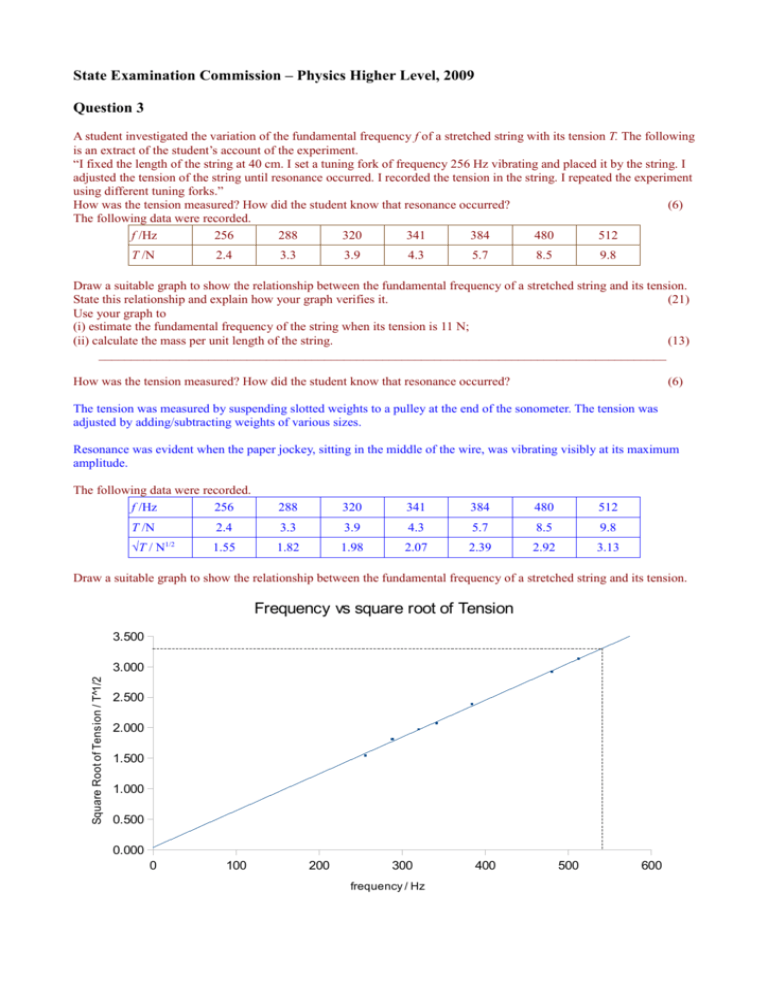
State Examination Commission – Physics Higher Level, 2009 Question 3 A student investigated the variation of the fundamental frequency f of a stretched string with its tension T. The following is an extract of the student’s account of the experiment. “I fixed the length of the string at 40 cm. I set a tuning fork of frequency 256 Hz vibrating and placed it by the string. I adjusted the tension of the string until resonance occurred. I recorded the tension in the string. I repeated the experiment using different tuning forks.” How was the tension measured? How did the student know that resonance occurred? (6) The following data were recorded. f /Hz 256 288 320 341 384 480 512 T /N 2.4 3.3 3.9 4.3 5.7 8.5 9.8 Draw a suitable graph to show the relationship between the fundamental frequency of a stretched string and its tension. State this relationship and explain how your graph verifies it. (21) Use your graph to (i) estimate the fundamental frequency of the string when its tension is 11 N; (ii) calculate the mass per unit length of the string. (13) ________________________________________________________________________________________ How was the tension measured? How did the student know that resonance occurred? (6) The tension was measured by suspending slotted weights to a pulley at the end of the sonometer. The tension was adjusted by adding/subtracting weights of various sizes. Resonance was evident when the paper jockey, sitting in the middle of the wire, was vibrating visibly at its maximum amplitude. The following data were recorded. f /Hz 256 T /N 1/2 √T / N 288 320 341 384 480 512 2.4 3.3 3.9 4.3 5.7 8.5 9.8 1.55 1.82 1.98 2.07 2.39 2.92 3.13 Draw a suitable graph to show the relationship between the fundamental frequency of a stretched string and its tension. Frequency vs square root of Tension 3.500 Square Root of Tension / T^1/2 3.000 2.500 2.000 1.500 1.000 0.500 0.000 0 100 200 300 frequency / Hz 400 500 600 State this relationship and explain how your graph verifies it. (21) Frequency is proportional to the square root of the tension as verified by the straight line through the origin Use your graph to (i) estimate the fundamental frequency of the string when its tension is 11 N; If T = 11 N then, √T = 3.32 N1/2 From the graph, when √T = 3.32, f = 540 Hz (ii) calculate the mass per unit length of the string. 1 T f= 2l μ √ T =2 l √μ ⇒ f 3.32 ⇒ =2( 0.4) √μ 540 −5 −1 ⇒μ=5.9 x 10 kg m √ (13)
