Abstract
advertisement
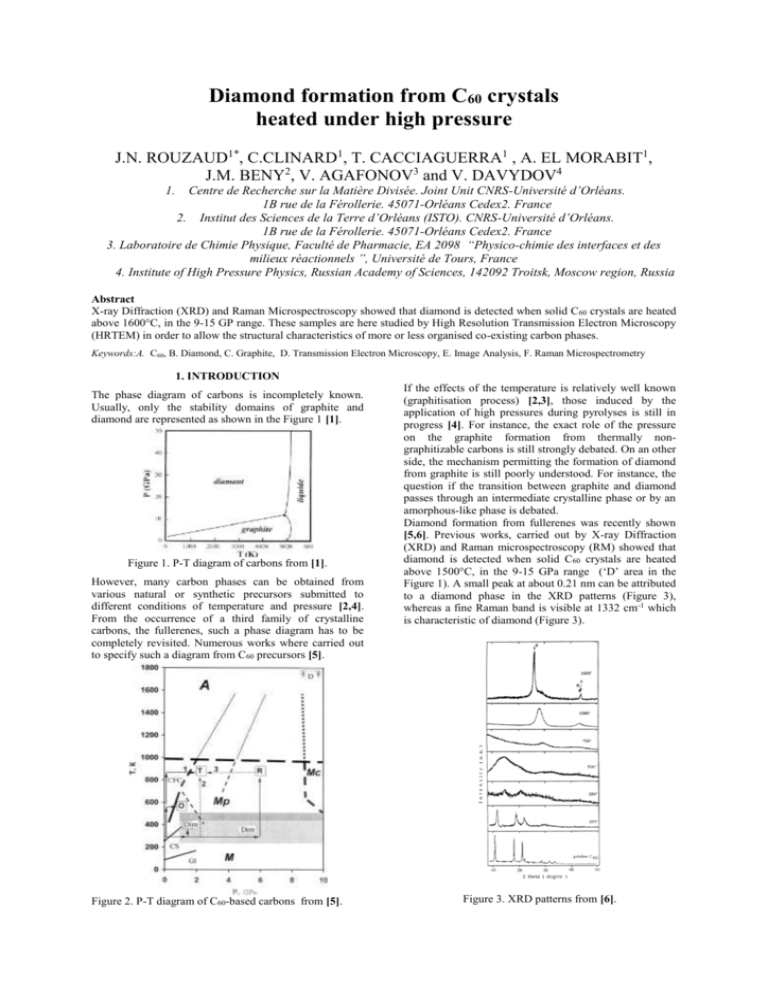
Diamond formation from C60 crystals heated under high pressure J.N. ROUZAUD1*, C.CLINARD1, T. CACCIAGUERRA1 , A. EL MORABIT1, J.M. BENY2, V. AGAFONOV3 and V. DAVYDOV4 Centre de Recherche sur la Matière Divisée. Joint Unit CNRS-Université d’Orléans. 1B rue de la Férollerie. 45071-Orléans Cedex2. France 2. Institut des Sciences de la Terre d’Orléans (ISTO). CNRS-Université d’Orléans. 1B rue de la Férollerie. 45071-Orléans Cedex2. France 3. Laboratoire de Chimie Physique, Faculté de Pharmacie, EA 2098 “Physico-chimie des interfaces et des milieux réactionnels ”, Université de Tours, France 4. Institute of High Pressure Physics, Russian Academy of Sciences, 142092 Troitsk, Moscow region, Russia 1. Abstract X-ray Diffraction (XRD) and Raman Microspectroscopy showed that diamond is detected when solid C 60 crystals are heated above 1600°C, in the 9-15 GP range. These samples are here studied by High Resolution Transmission Electron Microscopy (HRTEM) in order to allow the structural characteristics of more or less organised co-existing carbon phases. Keywords:A. C60, B. Diamond, C. Graphite, D. Transmission Electron Microscopy, E. Image Analysis, F. Raman Microspectrometry 1. INTRODUCTION The phase diagram of carbons is incompletely known. Usually, only the stability domains of graphite and diamond are represented as shown in the Figure 1 [1]. Figure 1. P-T diagram of carbons from [1]. However, many carbon phases can be obtained from various natural or synthetic precursors submitted to different conditions of temperature and pressure [2,4]. From the occurrence of a third family of crystalline carbons, the fullerenes, such a phase diagram has to be completely revisited. Numerous works where carried out to specify such a diagram from C 60 precursors [5]. Figure 2. P-T diagram of C60-based carbons from [5]. If the effects of the temperature is relatively well known (graphitisation process) [2,3], those induced by the application of high pressures during pyrolyses is still in progress [4]. For instance, the exact role of the pressure on the graphite formation from thermally nongraphitizable carbons is still strongly debated. On an other side, the mechanism permitting the formation of diamond from graphite is still poorly understood. For instance, the question if the transition between graphite and diamond passes through an intermediate crystalline phase or by an amorphous-like phase is debated. Diamond formation from fullerenes was recently shown [5,6]. Previous works, carried out by X-ray Diffraction (XRD) and Raman microspectroscopy (RM) showed that diamond is detected when solid C60 crystals are heated above 1500°C, in the 9-15 GPa range (‘D’ area in the Figure 1). A small peak at about 0.21 nm can be attributed to a diamond phase in the XRD patterns (Figure 3), whereas a fine Raman band is visible at 1332 cm-1 which is characteristic of diamond (Figure 3). Figure 3. XRD patterns from [6]. Figure 4. Raman spectra from [6]. However the major phase visible by these two techniques seems to be a graphitised phase (d002 at about 0.34 nm in the XRD patterns, and a very strong band near 1580 cm-1 in the Raman spectra). This transformation occurs via unknown phases, the which being poorly organised as shown by the broadness of the bands in the XRD patterns, as in the Raman spectra. One of these intermediate carbon phase, assumed to have hardness comparable to the diamond one [5], gives, in the XRD patterns, interlayer spacings as small as 0.315 nm, i.e. narrower than the d 002 graphite value (0.3354 nm), but far from the d 111 diamond one (0.206 nm). For a better understanding of these structural transformations, we chose to study the series of C60 heated at high temperatures under high pressures, previously studied by DRX and Raman. These carbons will be characterized by High Resolution Transmission Electron Microscopy techniques in order to directly image individually their multiscale organisation (structure and microtexture). 2. EXPERIMENTAL 2.1 Sampling We chose a series of C60 heated until 2000°C under pressures until 15 GPa. The low-temperature – low pressure samples, which are soft, were classically gently ground in an agate mortar. By contrast, for high temperature – high pressure samples, where hard phases could present [5], whereas very thin fragments (thickness < 10 nm) are required to be observable by HRTEM. Such samples can no longer be thinned by the usual methods : too hard to be ground by agate mortar or cut by ultramicrotomy, even with a diamond knife, whereas ion thinning could induce undesirable amorphisation effects. As these carbons could be brittle, we developed a special cell in order to crush them. We construct a hollow cylinder in a steel piece, the internal part being covered with a hard tungsten carbide (WC) coating. Some grains of the sample are put in the cylinder, then a WC-based ball (with a diameter equal to the internal one of the cylinder) was introduced, and the so-filled cylinder was hermetically closed by a WC-based hat. This sealed cylinder was put in an stirrer during a few seconds up to a few minutes, allowing the formation of thin fragments by shocks. Unfortunately, such grinding could induce violent shocks appearing responsible for structural modifications for the diamond itself. This was pointed by a study we performed on a microcrystalline powder of pure diamond. The characteristic diamond Raman band is shifted from 1332 to below 1320 cm-1 and noticeably broadens. Such changes were previously attributed to the shocks inducing phase changes from the cubic form of diamond to the hexagonal one [7]. As a such carbon phase could be suspected to be also suspected as a possible intermediate for the cubic diamond formation, its eventual formation during sample preparation must be absolutely avoided. Moreover, grinding during a few minutes induces pollution by nanometer sized particles from the tungsten carbide coating. Consequently, the grinding time has to be reduced to a few seconds to avoid such artifacts (this can be checked by Raman spectroscopy) and pollution by WC particles (as controlled by HRTEM coupled with local elemental analysis by Energy Dispersive Spectroscopy). 2.2. Methods of Characterization. 2.2.1. HRTEM High-resolution transmission electron microscopy (HRTEM), thanks to its lattice-fringe mode, can be used as a tool to image the profile of the atomic planes forming the skeleton of the carbons. In the case of graphitic carbons, the profile of the aromatic layers can be directly imaged (002 lattice fringe mode), as shown in the figure 5; in the case of the graphite crystal, the interlayer spacing is 0.3335 nm, and it can be easily detected by usual microscopes. 1 nm Figure 5. 002 lattice fringe TEM image of graphite When the degree of graphitization is lower, the d 002 interlayer spacing increases and can reach 0.4 nm in lowrank natural carbons such as anthracites, or in lowtemperature carbons as adsorbent carbons. The organization of such disordered carbons is easily imaged by HRTEM as shown in the figure 6. poorly organized and thus difficult to detect by XRD and Raman microspectrometry. 3. RESULTS-DISCUSSION Packed C60 spheres remain clearly visible until 660°C, 2,5 GPa, as shown in the Figure 7 . Figure 6. TEM image (002 lattice fringe mode) of a poorly organized carbon (anthracite heated at 1000°C). The great advantage of the HRTEM is to image directly the different carbon phases co-existing in the samples, as it was suggested by XRD and RM data. This technique allows the detection and the characterization of amorphous-like or poorly organized carbons, responsible for the broad bands and the shoulders visible in the diffractograms and in the Raman spectra of the Figures 3 and 4, respectively. However, in the case of diamond crystals, the largest inter-planar spacings is only 0.206 nm (111 planes of the cubic diamond); consequently, most of usual microscopes, including the Philips CM20 here used, are not so far of their resolution limit (0.14 nm) and the imaging of the lattice fringe of diamond could become difficult, even impossible if the crystals are not lying exactly on the Bragg Angle (111 planes quasi-parallel to the electron beam). In the case of nanocrystals, the Bragg conditions are relaxed and lattice fringe images can be more easily obtained. However, the subsequent broadening of the reciprocal nodes lead to faint electron (and also X-ray) diffraction patterns with broad reflections and the structural parameters can no more obtained with precision. Thanks to an in-house image analysis procedure [8], developed in the CRMD (CNRS, Orleans, France), quantitative structural data can be obtained from the HRTEM images to accurately describe the carbon organization. The method consists on the following procedure : elimination of the background noise of the HRTEM images (by filtering at the fourier transform level), thresholding, skeletonization, followed by the extraction of structural and microtextural data performed on skeletonized images. De-averaged data can be obtained on fringes length, number of stacked layers in a coherent domain, interlayer spacings. In this case, measurements of such spacings can be obtained on nanometer-sized domains, with a precision of about +/- 0.01 nm. This is a great advantage on XRD only giving poor-in-information averaged data, and only on the most organized phases. Thanks to the HRTEM image analysis, it becomes possible to perform a structural characterization of the different carbon phases, co-existing in these frequently heterogeneous samples, even when these phases are Figure 7. HRTEM image of the sample obtained after heat-treatment up to 660°C under 15 GPa, showing the persistence of stacked C60 spheres. A graphitic-like phase appears at higher temperature and pressure (1300°C, 9.5 GPa). This carbon is formed by stacks of slightly wrinkled planes, the mean interlayer spacing being about 0.38 nm. Figure 8. HRTEM image of the sample obtained after heat-treatment up to 1500°C under 15 GPa. The Selected Area Electron Diffraction (SEAD) patterns show this carbon is turbostratic (only hk bands). This poorly organized phase is very frequent at 1500°C. Two carbon phases, with an higher structural order, were detected in the sample heated to 1900°C under 15 GPa : - a carbon made of the stacking of practically planar layers, with an interlayer spacing of about 0.33 nm (Figure 9); such spacing is slightly smaller than the d002 (0.3354 nm), but much larger than the largest spacings possible in diamond (0.206 nm for the cubic form, 0.219 nm for the hexagonal one, i.e. the lonsdaleite). Such carbon phase could correspond to the phase already detected by XRD on this series of samples [6]. Figure 10. HRTEM image of the sample obtained after heat-treatment up to 1900°C under 15 GPa. This series of samples are studied by HRTEM in order to allow the structural characteristics of the various carbon phases, including the more or less organised ones. First results show the presence of a turbostratic phase, and two “new” well organized carbon phases characterized by unusual interlayer spacings. Work is in progress in order to specify the occurrence of these carbon phases and to quantify their amounts versus temperature and pressure. REFERENCES Figure 9. HRTEM image of the sample obtained after heat-treatment up to 1900°C under 15 GPa. - a carbon phase characterized by large interlayer spacings, until about 0.7 nm (Figure 10). Such extraordinary spacings could correspond to the new carbon phase occurring in thermobaric treatment of C60 up to 1300K and 13 Gpa, and described by V.D Blank et al on the basis of electron diffraction patterns [9]. As proposed by these authors, this new phase may be considered as intermediate between graphite and diamond. This phase could be similar to the chaoite, the carbon crystal found in the shock-induced graphite-diamond transition in the carbonaceous rocks from the Ries meteor crater [10]. HRTEM studies, including image analysis and electron diffraction, have now to be developed to determine at which temperature and pressure these different carbon phases occur, and to specify the evolution of their amounts during the heat treatment under pressure. 4. CONCLUSION X-ray Diffraction (XRD) and Raman microspectroscopy (RM) showed that diamond is detected when solid C60 crystals are heated above 1500°C, in the 9-15 GPa range. [1] Bundy FP, Bassett WA, Weathers MS, Hemley MJ, Mao HK, Goncharov AF. The pressure-Temperature phase and transformation diagram for Carbon ; Updated through 1994. Carbon 34 (1996) 141-153. [2] Oberlin A. High-Resolution TEM Studies of carbonisation and Graphitization. In Thrower PA, editor Chemistry and Physics of Carbon, Vol 22, New York: Marcel Dekker, 1989: 1-143. [3] Rouzaud JN, Oberlin A. Structure, microtexture and optical properties of anthracene and saccharose-based carbons. Carbon 27 (1989), 517-529. [4] Beyssac O, Brunet F, Petitet JP, Goffé B, Rouzaud JN. Experimental study of the microtextural and structural transformations of carbonaceous materials under pressure and temperature. European J. Mineralogy (2003), in press. [5] Blank VD, Buga SG, Serebryanaya NR, Dubitsky GA, Mavrin BN, Popov MY, Bagramov RH, Prokhorov VM, Sulyanov SN, Kulnitskiy BA, Tatyanin YV. Structures and physical properties of superhard and ultrahard 3D polymerized fullerites created from solid C60 by high pressure high temperature treatment. Carbon 36 (1998) 665-670. [6] Szwarc H, Davydov VA, Plotianskaya GA, Kashevarova LS, Agafonov V, Ceolin R. Chemical modifications of C60 under the influence of pressure and temperature : from cubic C60 to diamond. Synthetic Metals 77 (1996) 265-272. [7] Knight DS, White WB. Characterization of diamond films by Raman spectroscopy. J. Mater. Res. 4 (1989) 385- 393. [8] Rouzaud JN, Clinard C. Quantitative high-resolution transmission electron microscopy: a promising tool for carbon materials characterization. Fuel Processing Technology 2002; 77-78, 229-235 [9] Blank VD, Kulnistskiy BA, Tatyanin YV, Zhigalina OM. A new phase of carbon. Carbon 37 (1999) 549-554. [10] El Goresy A, Donnay G. Science 1968;161:363 .
