Y chart - Curriculum Support
advertisement
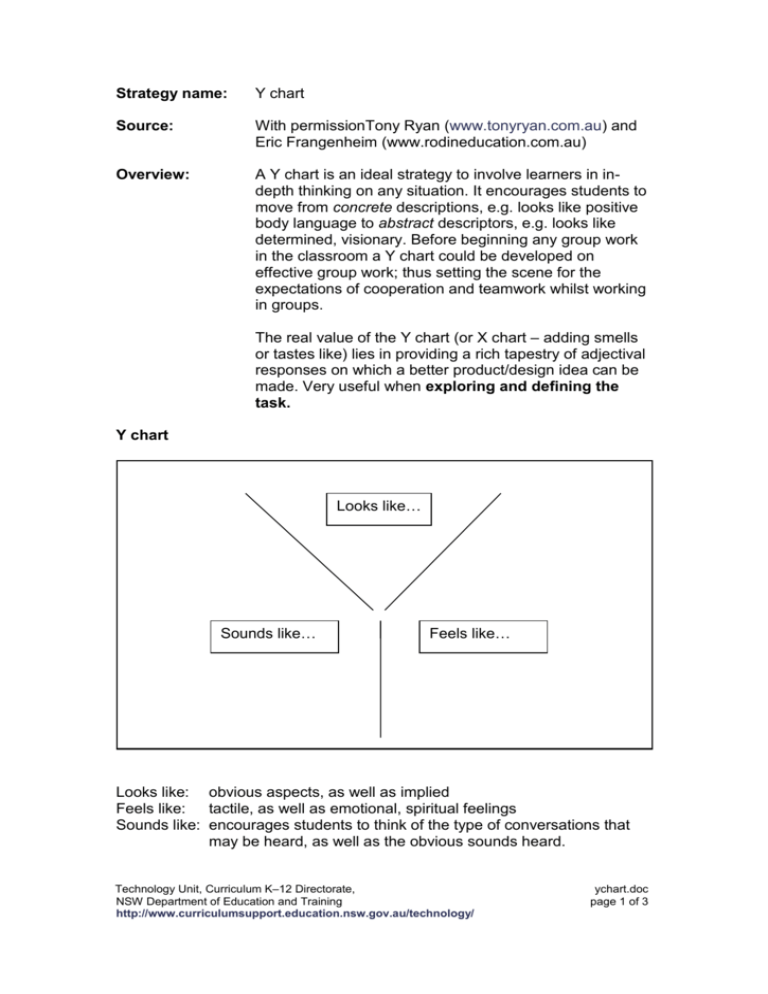
Strategy name: Y chart Source: With permissionTony Ryan (www.tonyryan.com.au) and Eric Frangenheim (www.rodineducation.com.au) Overview: A Y chart is an ideal strategy to involve learners in indepth thinking on any situation. It encourages students to move from concrete descriptions, e.g. looks like positive body language to abstract descriptors, e.g. looks like determined, visionary. Before beginning any group work in the classroom a Y chart could be developed on effective group work; thus setting the scene for the expectations of cooperation and teamwork whilst working in groups. The real value of the Y chart (or X chart – adding smells or tastes like) lies in providing a rich tapestry of adjectival responses on which a better product/design idea can be made. Very useful when exploring and defining the task. Y chart Looks like… Sounds like… Feels like… Looks like: obvious aspects, as well as implied Feels like: tactile, as well as emotional, spiritual feelings Sounds like: encourages students to think of the type of conversations that may be heard, as well as the obvious sounds heard. Technology Unit, Curriculum K–12 Directorate, NSW Department of Education and Training http://www.curriculumsupport.education.nsw.gov.au/technology/ ychart.doc page 1 of 3 Using Y chart for exploring and defining the task Y charts can be developed for a variety of purposes, not only attitudinal or behavioural outcomes, but also for exploring the development of a product or design. For example, if exploring the local built environment to discover what already exists, students attention could be drawn to experiencing what the environment looks, feels and sounds like and maybe even smells like, e.g. industrial areas, heavy traffic areas, if an X chart is used. An industrial area may sound noisy, harsh whilst a natural environment may sound melodic, pleasing. Students can build a more sensory image of their surroundings and be better able to explain the need for proposed changes. An example of a Y chart is shown below. Effective leadership looks like… Clear plans Positive body language Delegating to others Ability to handle many tools, situations, etc. sounds like… Says we and not me Complimentary and encouraging others ‘We can do it!’ Applause and enthusiasm ‘What if we tried this?’ ‘What can I do for you?’ Had a great role model A visionary and goal setter Leading from the front Determined feels like… Supportive and patient Exciting to be in their company Determined Safe yet challenging Contagious enthusiasm Inspires positive feelings Caring Technology Unit, Curriculum K–12 Directorate, NSW Department of Education and Training http://www.curriculumsupport.education.nsw.gov.au/technology/ ychart.doc page 2 of 3 Looks like… Sounds like… Technology Unit, Curriculum K–12 Directorate, NSW Department of Education and Training http://www.curriculumsupport.education.nsw.gov.au/technology/ Feels like… ychart.doc page 3 of 3
