Cyberlab - Climate Changes and Coral Reefs
advertisement
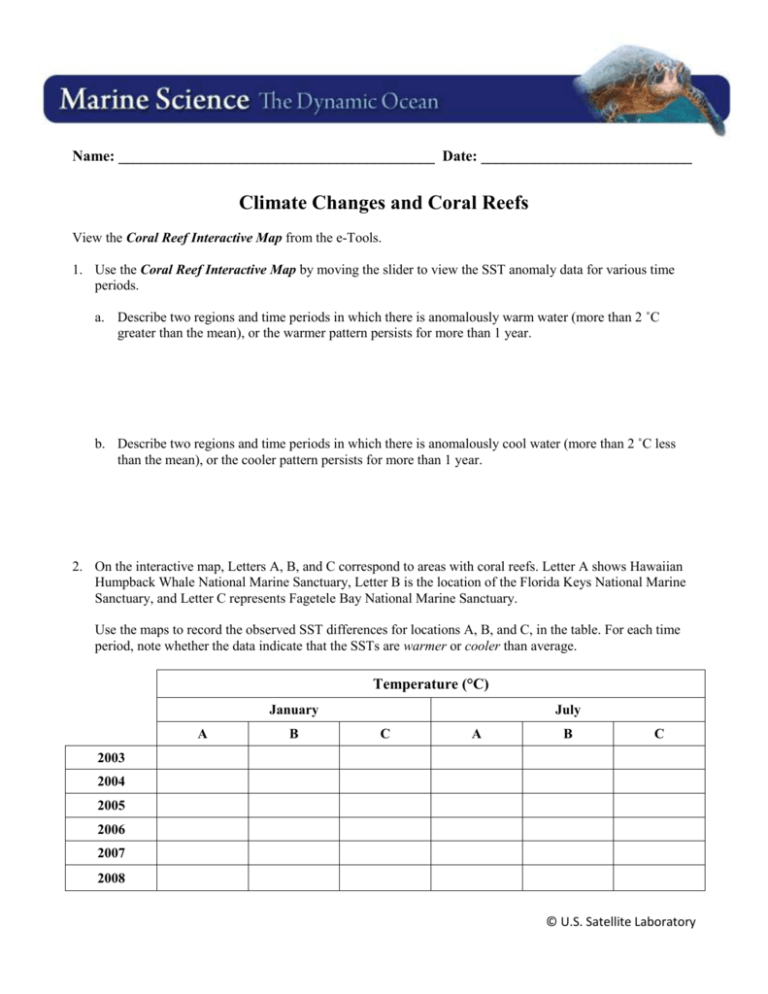
Name: __________________________________________ Date: ____________________________ Climate Changes and Coral Reefs View the Coral Reef Interactive Map from the e-Tools. 1. Use the Coral Reef Interactive Map by moving the slider to view the SST anomaly data for various time periods. a. Describe two regions and time periods in which there is anomalously warm water (more than 2 ˚C greater than the mean), or the warmer pattern persists for more than 1 year. b. Describe two regions and time periods in which there is anomalously cool water (more than 2 ˚C less than the mean), or the cooler pattern persists for more than 1 year. 2. On the interactive map, Letters A, B, and C correspond to areas with coral reefs. Letter A shows Hawaiian Humpback Whale National Marine Sanctuary, Letter B is the location of the Florida Keys National Marine Sanctuary, and Letter C represents Fagetele Bay National Marine Sanctuary. Use the maps to record the observed SST differences for locations A, B, and C, in the table. For each time period, note whether the data indicate that the SSTs are warmer or cooler than average. Temperature (°C) January A B July C A B C 2003 2004 2005 2006 2007 2008 © U.S. Satellite Laboratory 3. Which area, A, B or C, experienced consistently warmer than average temperatures in the years studied? © U.S. Satellite Laboratory
