JANE_1658_sm_figs_S1
advertisement
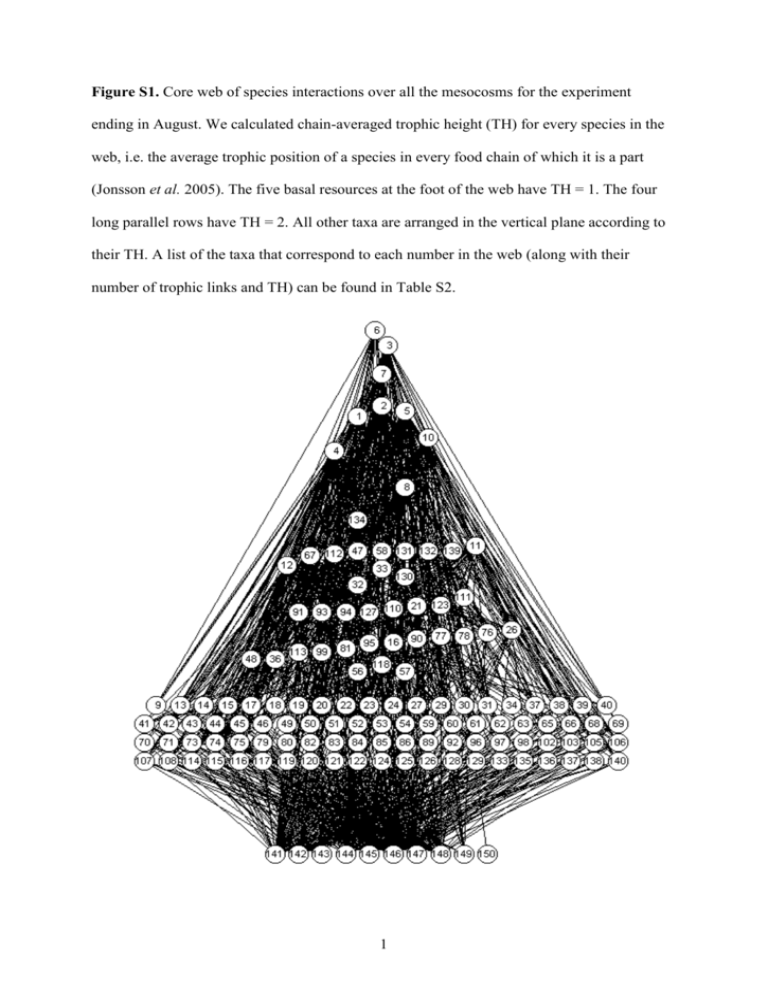
Figure S1. Core web of species interactions over all the mesocosms for the experiment ending in August. We calculated chain-averaged trophic height (TH) for every species in the web, i.e. the average trophic position of a species in every food chain of which it is a part (Jonsson et al. 2005). The five basal resources at the foot of the web have TH = 1. The four long parallel rows have TH = 2. All other taxa are arranged in the vertical plane according to their TH. A list of the taxa that correspond to each number in the web (along with their number of trophic links and TH) can be found in Table S2. 1 Figure S2. Core web of species interactions over all the mesocosms for the experiment ending in September. We calculated TH as in Figure 1. A list of the taxa that correspond to each number in the web (along with their number of trophic links and TH) can be found in Table S2. The turnover in species composition between the two months was measured as Whittaker’s index of beta diversity, βw = (s/α)-1, where s is the total number of species over the two months and α is the average species richness of the two months. βw = 0.1538, or in other words there was a 15% turnover of species (and thus 85% similarity in species composition between the composite webs for August and September). 2 Figure S3. Correlation between August and September estimates of mean absolute (a) theoretical direct effects, (b) theoretical net effects, (c) empirical direct effects and (d) empirical net effects. Values are plotted on a log-log scale with a power fitting. a) Theoretical Direct Effects -1 -2 b) Theoretical Net Effects r = 0.984 r = 0.962 n = 110 n = 110 Log10 mean absolute effects (August) -3 -4 -5 -6 -6 -5 -4 -3 -2 -1 -6 -5 -4 -3 -2 d) Empirical Net Effects c) Empirical Direct Effects 1 r = 0.760 r = 0.906 n = 66 n = 90 -1 -3 -5 -7 -7 -5 -3 -1 -5 -3 Log10 mean absolute effects (September) 3 -1 1
