Answer the following in your lab book
advertisement

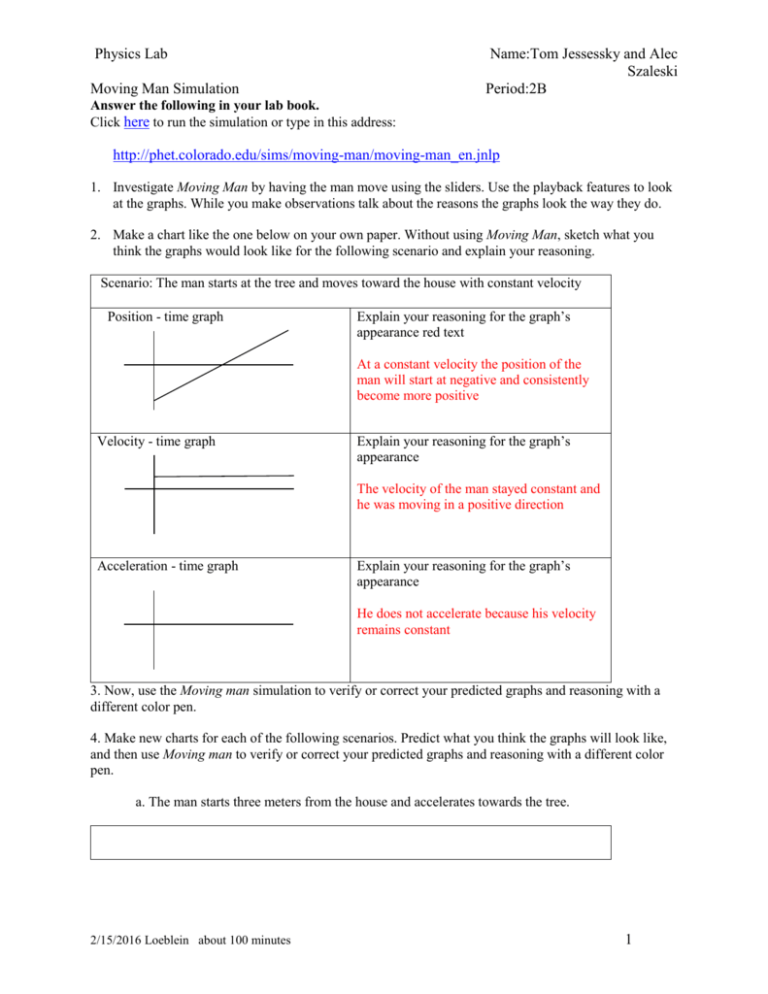
Physics Lab Name:Tom Jessessky and Alec Szaleski Period:2B Moving Man Simulation Answer the following in your lab book. Click here to run the simulation or type in this address: http://phet.colorado.edu/sims/moving-man/moving-man_en.jnlp 1. Investigate Moving Man by having the man move using the sliders. Use the playback features to look at the graphs. While you make observations talk about the reasons the graphs look the way they do. 2. Make a chart like the one below on your own paper. Without using Moving Man, sketch what you think the graphs would look like for the following scenario and explain your reasoning. Scenario: The man starts at the tree and moves toward the house with constant velocity Position - time graph Explain your reasoning for the graph’s appearance red text At a constant velocity the position of the man will start at negative and consistently become more positive Velocity - time graph Explain your reasoning for the graph’s appearance The velocity of the man stayed constant and he was moving in a positive direction Acceleration - time graph Explain your reasoning for the graph’s appearance He does not accelerate because his velocity remains constant 3. Now, use the Moving man simulation to verify or correct your predicted graphs and reasoning with a different color pen. 4. Make new charts for each of the following scenarios. Predict what you think the graphs will look like, and then use Moving man to verify or correct your predicted graphs and reasoning with a different color pen. a. The man starts three meters from the house and accelerates towards the tree. 2/15/2016 Loeblein about 100 minutes 1 Physics Lab Moving Man Simulation Name:Tom Jessessky and Alec Szaleski Period:2B Reasoning: Because he is accelerating the position change is slow at first but as he accelerates the position change is faster and the line curves because of the changing slope of the line. Though his speed is increasing, the direction is negative which makes his velocity negative causing the downward slope of the line. Because his velocity is negative his acceleration is also negative and he accelerates at a constant rate which makes the line flat b. The man stands still while he talks on his cell phone at the middle of the sidewalk, then walks toward the house at a constant rate trying to get better cell reception. He comes to a sudden stop when the coverage is good (about a meter before the house) and stands still to finish his conversation. Scenario: Position - time graph Explain your reasoning for the graph’s appearance red text At a stop his position stays the same then his position increases constantly then his position stays the same when he stops again Velocity - time graph Explain your reasoning for the graph’s appearance His velocity is zero while he is standing then his velocity is a constant positive value while he moves then goes back to zero 2/15/2016 Loeblein about 100 minutes 2 Physics Lab Moving Man Simulation Acceleration - time graph Name:Tom Jessessky and Alec Szaleski Period:2B Explain your reasoning for the graph’s appearance The man is not accelerating while standing still but accelerates for a moment while before he starts moving forward then goes back to zero acceleration then when he stops he negatively accelerates and goes back to zero. c.. The man starts close to the house, stands still for a little while, then walks toward the tree at a constant rate for a while, then the slows to a stop. Position - time graph Velocity - time graph Explain your reasoning for the graph’s appearance red text At a stop his position is the value of where he is standing then his position becomes more negative as he moves toward the tree and as he slows his position curves then his position remains constant at the stop. Explain your reasoning for the graph’s appearance The velocity is zero as he is standing still then is constantly negative as he moves toward the tree then curves as he slows down and comes to a stop Acceleration - time graph Explain your reasoning for the graph’s appearance The acceleration is negative after the man begins walking with a negative velocity. It increases to a constant value as he slows down then goes back down to zero when he stops. 5. Look at your graphs, reasonings and the corrections from questions 2 and 3. Talk about why some of your predictions were wrong and how your ideas about motion have changed. Some of our predictions were wrong because we got confused about which values would be negative and positive because of the position values of the simulation. Our ideas about motion have changed because we have started to understand the different looks of each of the position, velocity, and acceleration graphs and their relationships. 2/15/2016 Loeblein about 100 minutes 3 Physics Lab Name:Tom Jessessky and Alec Szaleski Period:2B Moving Man Simulation 6. Sketch the position, velocity and acceleration graphs for the following scenario: A man wakes up from his nap under the tree and speeds up toward the house. He stops because he is worried that he dropped his keys. He stands still as he searches his pockets for his keys. Once he finds them, he continues calmly to walk toward the house and then slows to a stop as he nears the door. Position Velocity Acceleration 7. With your lab partners, write a motion scenario that you could test. Test it, and then write a description of how you used the program to generate the graphs. Sketch the graphs. A man is confused about directions to the house but is too afraid to ask for help. He walks toward the tree at a steady rate then turns around and accelerates all the way to the house and stops. How to use the program: Have the man at position 0 and set velocity to -2m/s. Let him get to the tree then set the velocity to 2m/s and the acceleration to 1m/s/s. Have him reach the house then set the velocity and acceleration to 0 and have him stop at house. Position: Velocity 8 2/15/2016 Loeblein about 100 minutes 4 Physics Lab Moving Man Simulation Name:Tom Jessessky and Alec Szaleski Period:2B Acceleration 8. Individually write a possible scenario for the following graph. Then compare your scenario with your lab partners to check if its reasonable. time The man starts at the wall and moves toward the house while slightly accelerating then slows down and stops for a few seconds, turns around accelerates back toward the wall and begins to slow down again. 2/15/2016 Loeblein about 100 minutes 5


