Process Capability
advertisement
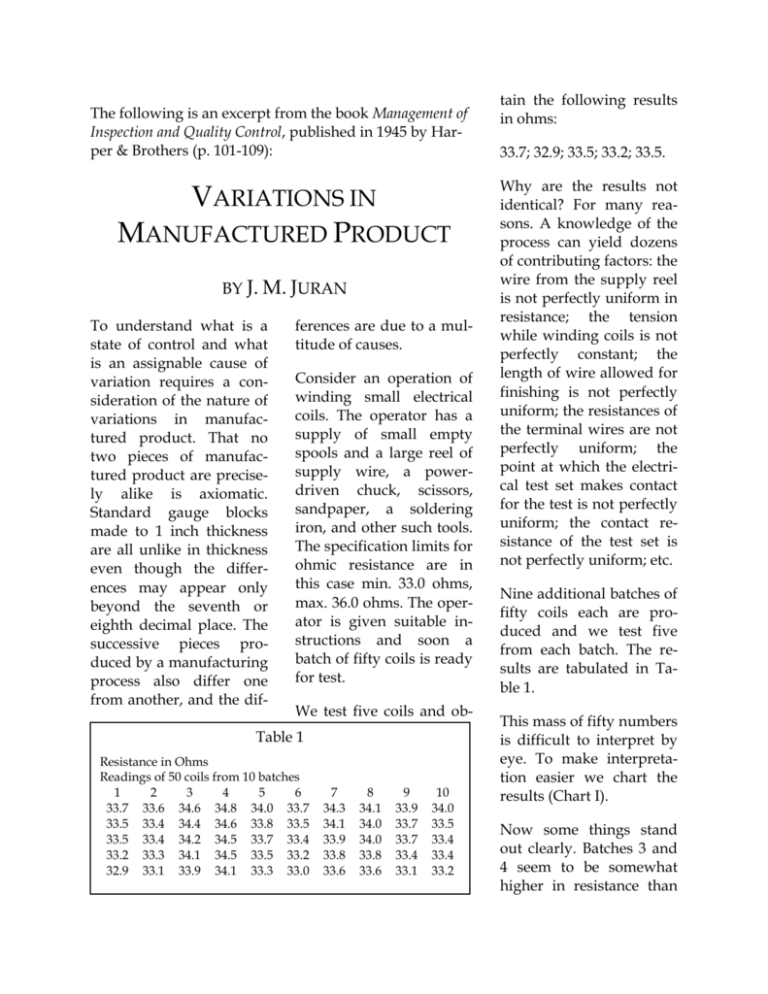
The following is an excerpt from the book Management of Inspection and Quality Control, published in 1945 by Harper & Brothers (p. 101-109): VARIATIONS IN MANUFACTURED PRODUCT BY J. M. JURAN To understand what is a state of control and what is an assignable cause of variation requires a consideration of the nature of variations in manufactured product. That no two pieces of manufactured product are precisely alike is axiomatic. Standard gauge blocks made to 1 inch thickness are all unlike in thickness even though the differences may appear only beyond the seventh or eighth decimal place. The successive pieces produced by a manufacturing process also differ one from another, and the dif- ferences are due to a multitude of causes. Consider an operation of winding small electrical coils. The operator has a supply of small empty spools and a large reel of supply wire, a powerdriven chuck, scissors, sandpaper, a soldering iron, and other such tools. The specification limits for ohmic resistance are in this case min. 33.0 ohms, max. 36.0 ohms. The operator is given suitable instructions and soon a batch of fifty coils is ready for test. We test five coils and ob- Table 1 Resistance in Ohms Readings of 50 coils from 10 batches 1 2 3 4 5 6 33.7 33.6 34.6 34.8 34.0 33.7 33.5 33.4 34.4 34.6 33.8 33.5 33.5 33.4 34.2 34.5 33.7 33.4 33.2 33.3 34.1 34.5 33.5 33.2 32.9 33.1 33.9 34.1 33.3 33.0 7 34.3 34.1 33.9 33.8 33.6 8 34.1 34.0 34.0 33.8 33.6 9 33.9 33.7 33.7 33.4 33.1 10 34.0 33.5 33.4 33.4 33.2 tain the following results in ohms: 33.7; 32.9; 33.5; 33.2; 33.5. Why are the results not identical? For many reasons. A knowledge of the process can yield dozens of contributing factors: the wire from the supply reel is not perfectly uniform in resistance; the tension while winding coils is not perfectly constant; the length of wire allowed for finishing is not perfectly uniform; the resistances of the terminal wires are not perfectly uniform; the point at which the electrical test set makes contact for the test is not perfectly uniform; the contact resistance of the test set is not perfectly uniform; etc. Nine additional batches of fifty coils each are produced and we test five from each batch. The results are tabulated in Table 1. This mass of fifty numbers is difficult to interpret by eye. To make interpretation easier we chart the results (Chart I). Now some things stand out clearly. Batches 3 and 4 seem to be somewhat higher in resistance than batches 1 and 2. We seem to be encountering, between batches, some important variable. But do we in fact have such a variable? Frequently we can judge by eye, but in doubtful cases we can apply our statistical gauge, and it will resolve the doubt for us. To apply the statistical gauge we must compute "control limits" (not to be confused with specification limits). Control limits are the boundaries of the variation in product which can reasonably be expected from a controlled process. If the inspection data remain within the control limits, the process is performing at maximum uniformity. If any of the inspection data do fall outside the control limits, then the process is not doing all it can, and this because of the presence of some dominant variable which can be identified by an engi- neering investigation of the process. Applied to the case at hand, the control chart consists of plotting the average values of resistance on a chart on which the control limits are drawn. It is seen that lots 3 and 4 are indeed out of limits. Conclusion: the process is not controlled. FINDING ASSIGNABLE CAUSES OF VARIATION Why is the above process out of control? The control charts alone cannot answer this. The answer is to be found in the shop. So into the shop we go. We find that the shop supervisor had reasoned that to meet specification limits of min. 33.0 and max. 36.0 he should aim at the mean of 34.5. He secured an electricians' handbook and found that for this size of wire, at mean diameter, 34.5 ohms was the resistance of 10.0 2 feet of wire. The diameter of the spools was such that 10 feet of wire would yield 120 turns on a spool. Hence he instructed the operators to wind exactly 120 turns on each spool. We unwind several coils from lots 3 and 4 and find that they do indeed have 120 turns. The trouble is not caused by variation in the number of turns. Then we realize that the 120 turns is valid only for wire of mean diameter. Are the supply reels of wire all at mean diameter? As we go into this we find that the supply reels of wire contain about 1,000 feet each — enough for about 100 coils, or two lots of fifty. We measure ten foot lengths of wire from five different reels and we find measurements of 34.3, 32.8, 35.3, 34.6, 35.1. This spells trouble, for one of these lengths is already outside of specification limits, and coils wound from it will very likely be outside of limits. To eliminate this variable we talk with the engineers of the company furnishing this wire. They advise us that the wire is commercial and that the alternative would be to select down? Again we go into the shop. Table 2 Resistance in Ohms Readings of 50 coils from 10 batches 11 12 13 14 15 16 34.0 34.1 33.7 33.6 33.9 33.9 33.8 33.9 33.5 33.5 33.6 33.7 33.5 33.6 33.4 33.4 33.5 33.6 33.1 33.5 33.3 33.1 33.5 33.4 32.8 33.3 32.8 33.0 33.2 33.1 special reels of wire which meet these closer limits. This, they say, would be both burdensome and expensive. By this time the winding room supervisor has an idea. Why not cut from each reel a length of wire such that it measures 34.5 ohms and then cut the rest of that reel up into lengths equal to the sample? In this way we can take advantage of the uniformity within reels while avoiding the variation between reels. This is tried out, and the data are shown in Table 2. A new control chart (Chart II) is prepared. According to this chart, all is well, for the process shows control. But the shop supervisor is far from satisfied, for three of the fifty coils, or 6 per cent, are defective. Clearly, the ideal process is one which meets both 17 33.6 33.6 33.5 33.0 32.7 18 34.0 33.7 33.6 33.5 33.3 19 33.8 33.7 33.5 33.4 33.4 20 33.8 33.7 33.3 33.2 33.1 the control limits and the specification limits. Once again we chart the data, this time as though the coils were sorted in bins according to their electrical resistance (left-hand scatter chart of Chart II). A new situation has now become clear. Whereas we had cut the wires to measure 34.5 ohms, the finished coils cluster around 33.5 ohms. This average is too close to the minimum limit and allows the lowest resistance coils to be defective. This is an unhappy situation when we note that there is plenty of leeway near the maximum limit. But what made the resistance go 3 We examine the winding operation itself and the answer is obvious. In soldering the wire to its terminal, the operator scrapes the insulation off the wire several inches from each end. She then holds the wire with one hand while she solders, holding the soldering iron in the other hand. After soldering there remain at each end several inches to be clipped off. The reme- dy is obvious. We should provide these extra inches in the first place.1 This the shop supervisor does by cutting the lengths to measure 35.5 ohms at the outset. This change requires a change in the control chart (right-hand scatter chart of Chart II). Another solution is to solder the wire much closer to the end. 1 Now all is indeed well. Control has been achieved, and the product is well-centered between the specification limits. It now remains only to maintain control. Note that there are areas between the control limits and the product limits. As the process gets out of control, there will be time to take corrective action before defects are actually produced. This is a most desirable situation. RELATION OF CONTROL LIMITS TO SPECIFICATION LIMITS The reader is urged to study the above example carefully, for it embodies many important elements of the statistical control problem. In particular, the relation of control limits to specification limits should be fully understood. It must be realized at all times that the basic objective of the process is to meet the specification limits and to do so at a minimum of man-hours, materials, etc. In general, a controlled process is to be preferred over a process out of control. However, there are cases where the effort required to secure control cannot be justified in the light of the specification limits. To study this let us consider several classes of problems. A. Process not controlled, and product fails to meet specification limits. The above case of the coils being out of limits because of the reel-to-reel variable illustrates this point. In such cases a shop investigation should by all means be conducted. The object of the investigation should be an identification of the assignable causes, and an understanding of the difficulty of eliminating such causes. Economic considerations will then dictate whether to: (1) Eliminate the assignable cause (as was done by going to a measured length instead of using a count of number of turns). (2) Change the specification, e.g., changing the limits to max. 35 ohms, min. 32 ohms. (3) Endure the condition by sorting the product and repairing or junking the defectives. 4 Frequently it is found that elimination of the assignable cause is simple enough and the matter ends there. In other cases, elimination of the assignable cause may be very expensive. In such event, the engineers must be called in to decide whether or not the expense is warranted in the light of the importance of the specification limits. B. Process controlled, yet product fails to meet specification limits. The example of the coils which were out of limits because of the excess wire being clipped off illustrates this point. In such cases the answer is: (1) Make a compensating change in the process (as was done by providing more wire at the outset). (2) Change the specification (as by lowering the minimum limit to 32.5 ohms). (3) Endure the condition by sorting the product and repairing or junking the defectives. Again, the choice of these actions is an economic problem. C. Process not controlled, yet product meets the specification limits. If in the coil problem the limits had at the outset been max. 36 ohms, min. 32 ohms, then the product would have met the specification limits despite the lack of control. Under these conditions, would we have been warranted in making any investigation at all? Indeed, we would. Lack of control means that some important variable is rampant. We should at least know the nature of that variable in order to judge the extent to which it can affect the product. The same variable, for all we know, may shortly grow to an extent sufficient to put the product outside specification limits. Whether to go to the effort of eliminating the variable once it has been identified is quite another problem. If the coils all met the wider specification limits, would we have been warranted in going nonetheless to the more expensive procedure of cutting equal lengths of wire from a reel to take out the reel-to-reel variable? Possibly not. One cannot make it an in- flexible rule that if the specification limits are met one can forget control, any more than one can make it an inflexible rule that no matter how readily the product meets the specification limits, investigation must continue until control is attained. The answer involves a consideration of the numerous supplemental advantages of a state of control.2 D. The process is controlled and the product meets the specification limits. (The final result of the coil problem exemplifies this.) In general this situation calls for letting well enough alone. However, where the variations in product are quite small when compared to the specification tolerance, and where the process contains expensive operations to keep product variations small, it may be that some of these expensive operations can be dispensed with while still providing margin beSee "Guide for Quality Control and Control Chart Method of Analyzing Data," American Standards Association, Standard Z 1.1-1945 and 7 1.2, 1941. 2 5 tween the new control limits and the product limits. When the product is controlled and also within the specification limits, the control chart has an additional and almost startling use: in such event, the control chart can disclose any gradual tendency for the product to approach the specification limits before such tendency has produced defective pieces. We noted this in the coil example. The importance of this feature cannot be overemphasized. Not only is this feature an advance storm warning — it usually allows time to go into the shop for shutting off the storm. Finally, we must note that in general (but not always) the specification limits apply piece by piece, whereas the control limits apply to the process as a whole. There is an enormous, visionary and relatively unexplored field open to design engineers for development of functional limits which are keyed to the control limits of the manufacturing processes. This unexplored field involves a new philosophy of manufacture which offers great promise for still further im- provement in quality control. 6
