Y7SoW Support Statistics 3
advertisement
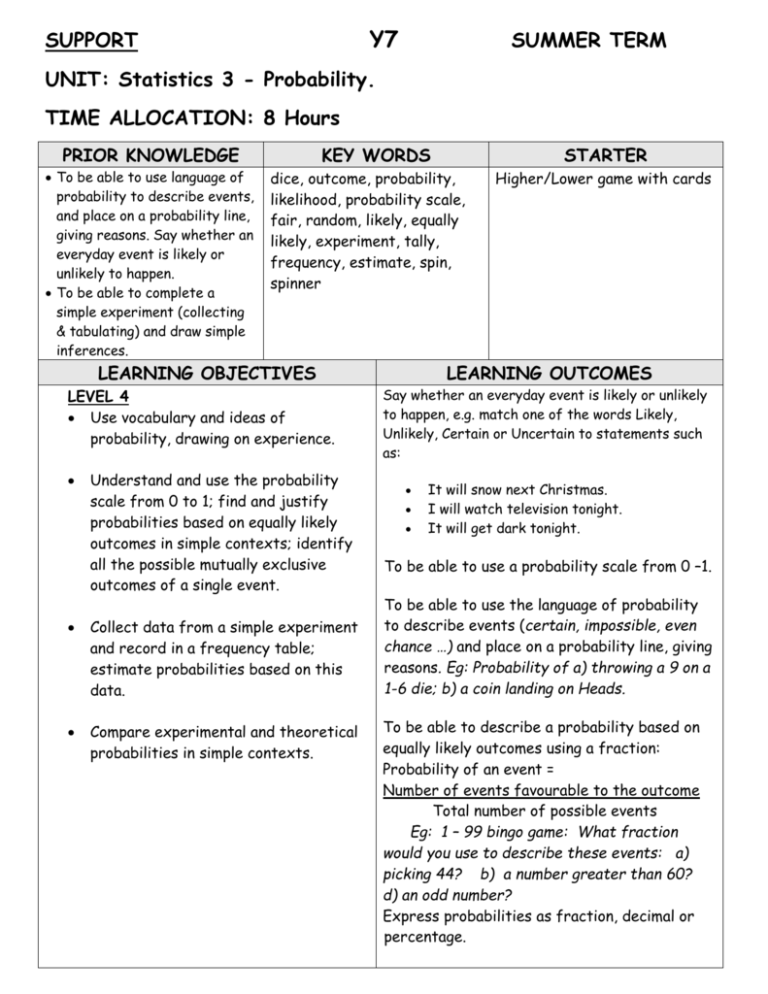
Y7 SUPPORT SUMMER TERM UNIT: Statistics 3 - Probability. TIME ALLOCATION: 8 Hours PRIOR KNOWLEDGE To be able to use language of probability to describe events, and place on a probability line, giving reasons. Say whether an everyday event is likely or unlikely to happen. To be able to complete a simple experiment (collecting & tabulating) and draw simple inferences. KEY WORDS dice, outcome, probability, likelihood, probability scale, fair, random, likely, equally likely, experiment, tally, frequency, estimate, spin, spinner LEARNING OBJECTIVES LEVEL 4 Use vocabulary and ideas of probability, drawing on experience. STARTER Understand and use the probability scale from 0 to 1; find and justify probabilities based on equally likely outcomes in simple contexts; identify all the possible mutually exclusive outcomes of a single event. Collect data from a simple experiment and record in a frequency table; estimate probabilities based on this data. Compare experimental and theoretical probabilities in simple contexts. Higher/Lower game with cards LEARNING OUTCOMES Say whether an everyday event is likely or unlikely to happen, e.g. match one of the words Likely, Unlikely, Certain or Uncertain to statements such as: It will snow next Christmas. I will watch television tonight. It will get dark tonight. To be able to use a probability scale from 0 –1. To be able to use the language of probability to describe events (certain, impossible, even chance …) and place on a probability line, giving reasons. Eg: Probability of a) throwing a 9 on a 1-6 die; b) a coin landing on Heads. To be able to describe a probability based on equally likely outcomes using a fraction: Probability of an event = Number of events favourable to the outcome Total number of possible events Eg: 1 – 99 bingo game: What fraction would you use to describe these events: a) picking 44? b) a number greater than 60? d) an odd number? Express probabilities as fraction, decimal or percentage. To be able to identify all the possible outcomes of a single event. To be able to collect data from a simple experiment and work out estimated (experimental) probabilities and draw simple inferences. Eg: A fairground spinner is marked 1 – 6. 3 is a win. Predict how often this should occur. Check by conducting an experiment (with a 1 – 6 die). Why are the 2 two probabilities different? ACTIVITIES ICT Carry out an experiment, e.g. coloured counters taken from a bag. Do the experiment twice to demonstrate the difference in the results but take out a counter as many as fifty times in each experiment to demonstrate similarities. Use the results to give experimental probabilities. Indicate these on a 0 to 1 line. Y7 Bring on the Maths Probability: v1, v2 KS3 Top-up Bring on the Maths Probability: v1 ATM Mathematical problem solving ~ Dice file questions MyMaths – Game Probability/Play Your Cards Right. RESOURCES FUNCTIONAL SKILLS and MPA OPPORTUNITIES PLENARIES AND KEY QUESTIONS Am I more likely to roll a 2 than a 6? Can I expect to roll more even numbers or more odd numbers? Which number do you think will occur most frequently? Where on the line would you put the event ... ? Is ... more likely than ... ? The probability it will rain tomorrow is ½ - True or False? Why? If I flip a coin 1000 times will I get 500 heads? If you repeat an experiment, will you always / sometimes / never get the same result? When you spin a coin, the probability of getting a head is ½. So if you spin a coin ten times you would get exactly five heads. Is this statement true or false? Why? You toss a coin 100 times and count the number of times you get a head. A robot is programmed to toss a coin 1000 times. Who is most likely to be closer to getting equal numbers of heads and tails? Why? Make up examples of equally likely outcomes with given probabilities, e.g. 0.5, 1/6, 0.2, etc. Justify your answers.

