Tests concerning proportions
advertisement
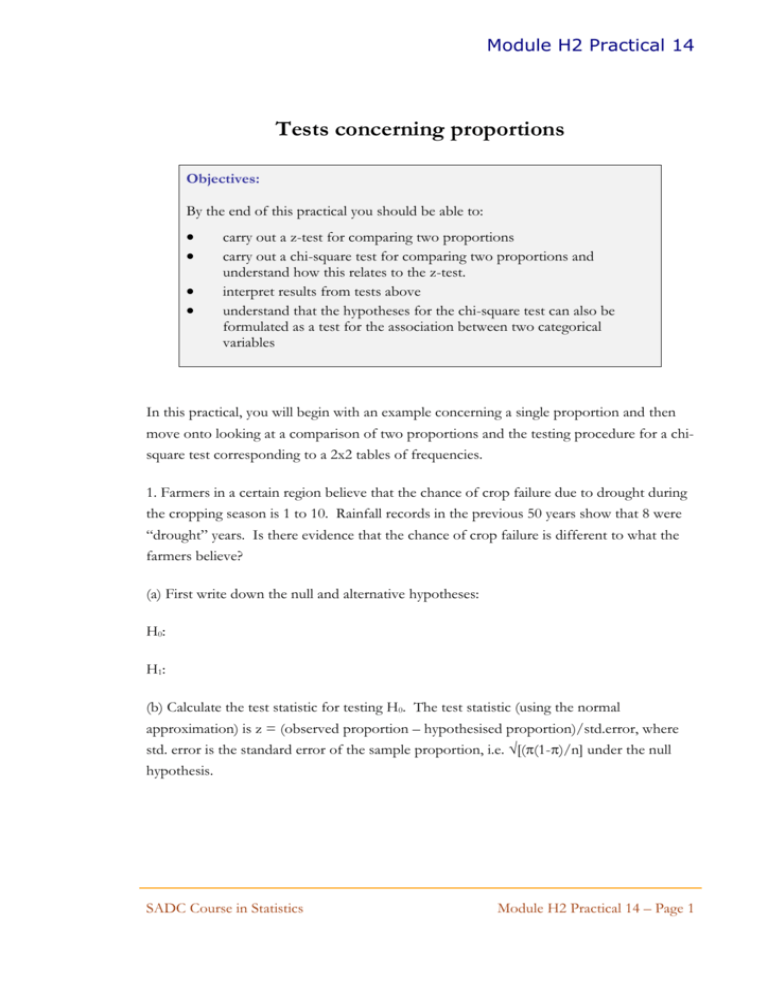
Module H2 Practical 14 Tests concerning proportions Objectives: By the end of this practical you should be able to: carry out a z-test for comparing two proportions carry out a chi-square test for comparing two proportions and understand how this relates to the z-test. interpret results from tests above understand that the hypotheses for the chi-square test can also be formulated as a test for the association between two categorical variables In this practical, you will begin with an example concerning a single proportion and then move onto looking at a comparison of two proportions and the testing procedure for a chisquare test corresponding to a 2x2 tables of frequencies. 1. Farmers in a certain region believe that the chance of crop failure due to drought during the cropping season is 1 to 10. Rainfall records in the previous 50 years show that 8 were “drought” years. Is there evidence that the chance of crop failure is different to what the farmers believe? (a) First write down the null and alternative hypotheses: H0: H1: (b) Calculate the test statistic for testing H0. The test statistic (using the normal approximation) is z = (observed proportion – hypothesised proportion)/std.error, where std. error is the standard error of the sample proportion, i.e. [((1-)/n] under the null hypothesis. SADC Course in Statistics Module H2 Practical 14 – Page 1 Module H2 Practical 14 (c) Interpret the results from your test above. (d) Compute a 95% confidence interval for the true chance of drought in the cropping season. What does this interval tell you? (e) Summarise your conclusions from the above analysis. 2. A standard farming practice (A) is to be compared with a new practice (B). Of 222 farmers adopting A, 169 had “high” crop yields, i.e. yields greater than the 25th percentile of the national average, while out of 235 using practice B, 205 had “high” yields. Is there evidence that the true proportions of farmers (1 and 2) getting “high” yields in the two populations (of those using practice A and those using practice B), are significantly different? (a) First write down the null and alternative hypotheses in terms of 1 and 2: H0: H1: (b) Calculate the difference between the two sample proportions. Next find an estimate of the standard error of the difference between these proportions, assuming the null hypothesis is true. SADC Course in Statistics Module H2 Practical 14 – Page 2 Module H2 Practical 14 (c) Carry out an z-test for testing the null hypothsis. Obtain the exact p-value for your zstatistic using the normdist function of Excel, i.e. use 1 – normdist(z,0,1,true) if your z statistic is positive, substituting for z, or use normdist(z,0,1,true) if your z statistic is negative. In either case, the result should be multiplied by 2 to get the two-tail p-value. (d) Interpret the results from your test above and summarise your conclusions. (e) Now display the data of this exercise in the form of a 2x2 table. Totals Totals (f) Next, calculated the expected frequencies under the null hypothesis. Totals Totals SADC Course in Statistics Module H2 Practical 14 – Page 3 Module H2 Practical 14 (g) Compute the chi-square test statistic and compare it with the appropriate value from the 2 table to assess the significance of your result. Also obtain the exact p-value for the test using the Excel function chidist(value,df). Does your p-value here match with what you obtained as the p-value following the z test in (c) above? Comment on this comparison. (h) You were requested in part (a) of this question, to formulate the hypotheses in terms of 1 and 2. Re-write the hypotheses in terms of a test of association between the two categorical variables presented in the table in part (e). (i) Does the above change affect your test procedure? Does it affect the way you present your conclusions? If so, rewrite your conclusions in the light of the hypotheses as written in (h) above. SADC Course in Statistics Module H2 Practical 14 – Page 4 Module H2 Practical 14 IF YOU HAVE TIME, TRY ALSO THE FOLLOWING: 3. In a certain town, 500 people chosen at random were asked whether they approved or disapproved of the government. Immediately after the poll, the government introduced a measure likely to be unpopular. The same 500 people were then asked the same question again. The interviewer set out the results in the following table and deduced that there was no conclusive evidence of a decrease in confidence. Approved Disapproved Before 250 250 After 230 270 A representative of the opposition party complained that the conclusion was wrong. From a more detailed examination of the data, he produced the following table. Before Approved After Disapproved Approved 215 15 Disapproved 35 235 He claimed that this showed strong evidence of a fall in government popularity, on the basis of data on those who altered their opinion. Discuss the two analyses and give your interpretation of the data. SADC Course in Statistics Module H2 Practical 14 – Page 5

