Quarter 2 Exam Review Sheet: 1) Use the following values to
advertisement
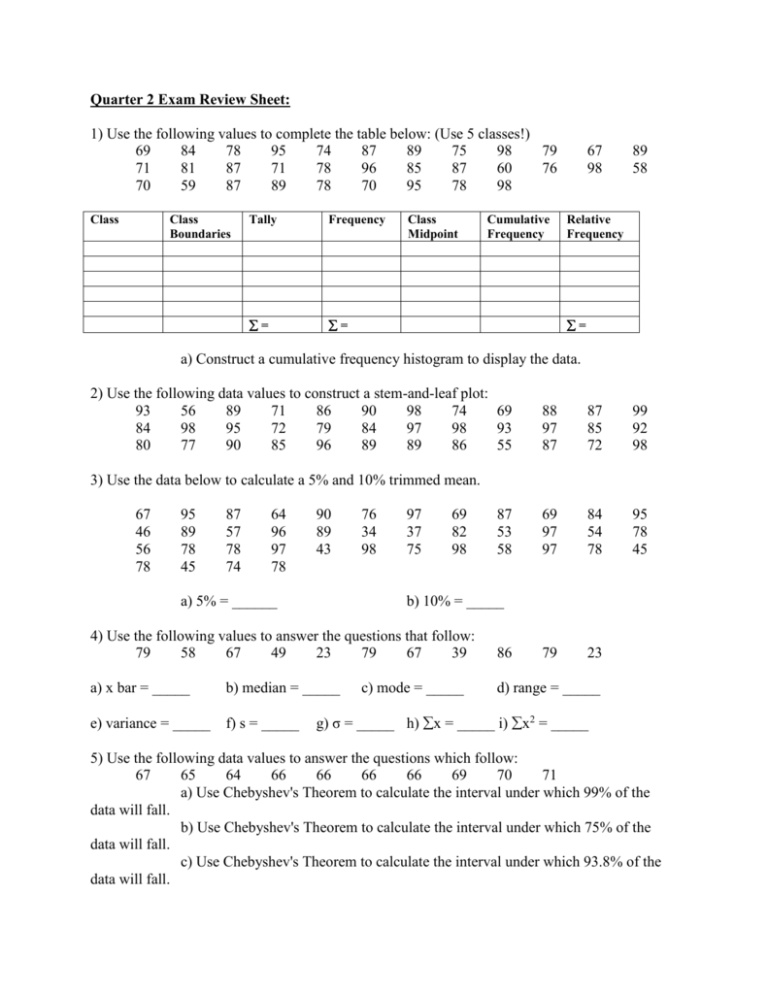
Quarter 2 Exam Review Sheet: 1) Use the following values to complete the table below: (Use 5 classes!) 69 84 78 95 74 87 89 75 98 79 71 81 87 71 78 96 85 87 60 76 70 59 87 89 78 70 95 78 98 Class Class Boundaries Tally Frequency = = Class Midpoint Cumulative Frequency 67 98 89 58 Relative Frequency = a) Construct a cumulative frequency histogram to display the data. 2) Use the following data values to construct a stem-and-leaf plot: 93 56 89 71 86 90 98 74 69 84 98 95 72 79 84 97 98 93 80 77 90 85 96 89 89 86 55 88 97 87 87 85 72 99 92 98 69 97 97 84 54 78 95 78 45 79 23 3) Use the data below to calculate a 5% and 10% trimmed mean. 67 46 56 78 95 89 78 45 87 57 78 74 64 96 97 78 90 89 43 a) 5% = ______ 76 34 98 97 37 75 69 82 98 87 53 58 b) 10% = _____ 4) Use the following values to answer the questions that follow: 79 58 67 49 23 79 67 39 86 a) x bar = _____ b) median = _____ d) range = _____ e) variance = _____ f) s = _____ c) mode = _____ g) σ = _____ h) x = _____ i) x2 = _____ 5) Use the following data values to answer the questions which follow: 67 65 64 66 66 66 66 69 70 71 a) Use Chebyshev's Theorem to calculate the interval under which 99% of the data will fall. b) Use Chebyshev's Theorem to calculate the interval under which 75% of the data will fall. c) Use Chebyshev's Theorem to calculate the interval under which 93.8% of the data will fall. 6) The closing prices of two stocks are recorded below: ABC 78 78 76 75 74 78 76 76 77 DEF 54 67 57 57 65 87 56 74 54 a) Calculate the coefficient of variation for each stock. b) If you are a conservative investor, which of the two stocks would you invest in? 7) Judges for the annual SFP lay-up contest rank each of the following categories on a scale of 1 - 10: vertical leap, use of backboard, proper hand, and finishing ability. The weights for each of these categories are as follows: vertical leap - 30%, use of backboard - 10%, proper hand - 5%, and finishing ability - 55%. Steve scores the following in each of the categories: vertical leap 6, use of backboard - 8, proper hand - 7, and finishing ability - 9. What did Steve score overall? 8) Find the mean & standard deviation when given the following grouped data: Class x f xf x - x bar (x - xbar)2 (x - xbar)2f 11 - 15 85 16 - 20 87 21 - 25 88 26 - 30 81 = = = 9) Use the following values to construct a box-and-whisker plot: 73 42 98 74 98 12 13 75 79 20 79 80 43 79 85 43 69 89 23 87 95 98 17 62 89 79 37 72 57 98 43 43 39 95 97 43

