Effect of off-axis beam through the buncher
advertisement

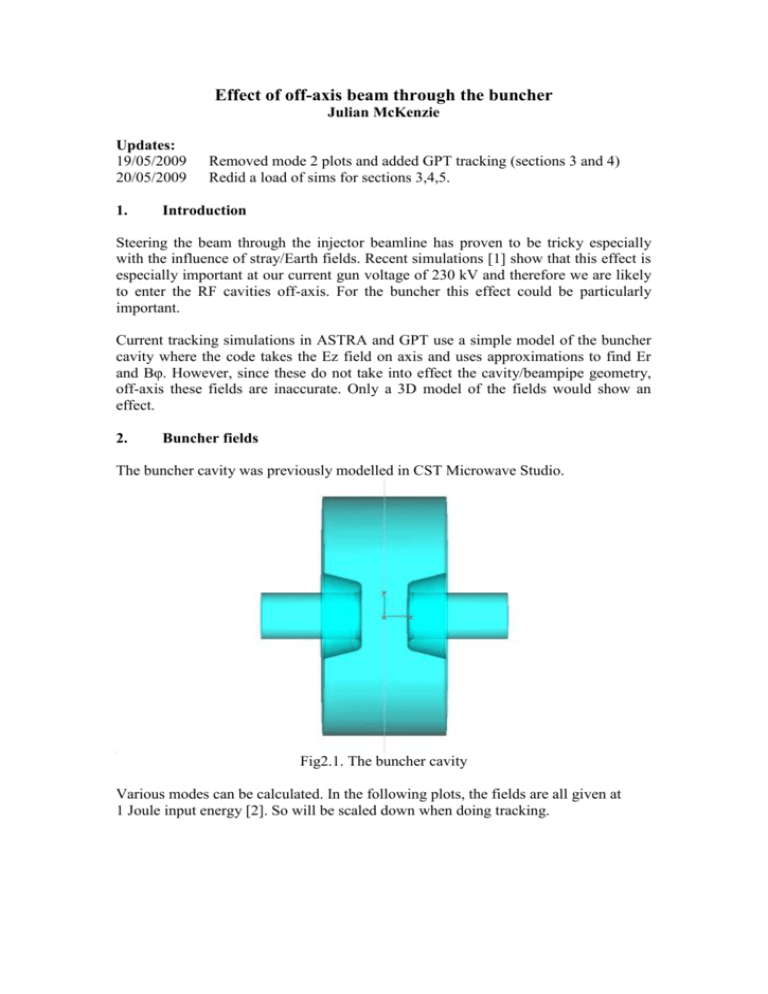
Effect of off-axis beam through the buncher Julian McKenzie Updates: 19/05/2009 20/05/2009 1. Removed mode 2 plots and added GPT tracking (sections 3 and 4) Redid a load of sims for sections 3,4,5. Introduction Steering the beam through the injector beamline has proven to be tricky especially with the influence of stray/Earth fields. Recent simulations [1] show that this effect is especially important at our current gun voltage of 230 kV and therefore we are likely to enter the RF cavities off-axis. For the buncher this effect could be particularly important. Current tracking simulations in ASTRA and GPT use a simple model of the buncher cavity where the code takes the Ez field on axis and uses approximations to find Er and Bφ. However, since these do not take into effect the cavity/beampipe geometry, off-axis these fields are inaccurate. Only a 3D model of the fields would show an effect. 2. Buncher fields The buncher cavity was previously modelled in CST Microwave Studio. Fig2.1. The buncher cavity Various modes can be calculated. In the following plots, the fields are all given at 1 Joule input energy [2]. So will be scaled down when doing tracking. 2.1 Mode 1 E-field Fig 2.2 This is the main accelerating mode at the peak accelerating phase. You can see that there is only a small transverse component but this increases with radius. Also note that we operate this at zero-crossing where this field is at a minimum (but only when the beam is at the centre of the cavity!). 2.2 Mode 1 H-field Fig. 2.2 At zero-crossing the E-field is a minimum, therefore the H-field is a maximum. At the bunching phase, it looks like this, looking down the beampipe. 3. On-axis particle tracking with GPT The E and H fields were exported from CST Microwave Studio with a 1mm grid in all 3-dimensions. To scale this down to the 1.3 MV/m peak fields as suggested by the Astra simulations [3] for the 230 keV gun setup, we have to scale this field down by a factor 0.03 since CST calculates the fields for 1 Joule of stored energy [2]. These fields can be imported into GPT for tracking using elements not included in the standard GPT release [4]. In the following simulations, the beam profile from [1] is used at the entrance to the buncher. This is the beam profile for 10,000 macroparticles created through tracking with GPT for the 230 keV injector setup not including stray fields into the calculation. This is shown in Fig3.1 Fig 3.1: Density profile of beam at buncher entrance. First a comparison was taken for the beam with tracking through 1D and 3D fields onaxis. In these simulations, the centre of the buncher cavity is at 1.3 m. The start of the simulation is the beginning of the beampipe as shown in Fig 2.1. The buncher was set to zero-crossing at the bunching phase. 1000 macroparticles were used for the tracking Fig 3.2 shows the 1D field case and Fig 3.3 shows the 3D field case. These plots show the trajectories of the macroparticles in the y-z plane. As can be seen the trajectories look largely similar. This shows that the expansion for fields close to the axis is accurate. Fig.3.2: 1D buncher fieldmap Fig 3.3: 3D buncher fieldmaps However, investigating this same situation with a larger beam with a halo, as seen in Fig 3.4 shows different results. The tracking of the core beam remains the same with both 1D (Fig 3.5) and 3D (Fig 3.6) maps but in the 3D case, stray particles off-centre get focussed into the core of the beam. This shows how the approximation for Ez for the 1D field case is not accurate off-axis. Fig 3.4: Density plot of a larger beam with a small amount of halo particles Fig.3.5: 1D buncher fieldmap with large beam Fig 3.6: 3D buncher fieldmaps with large beam 4. Off-axis particle tracking with GPT The beam from Fig 3.4 was then started with +5 and +10 mm in the y-direction. The three plots below show density profiles and the beam trajectories. Fig 4.0: Beam y + 0 mm. Fig 4.2: Beam y + 5 mm. Fig 4.3: Beam y + 10 mm. You can see that although the beam size stays the same, the beam is kicked a little further off-axis. It should also be noted that the buncher aperture is the smallest in the whole injector beamline. With the +10mm case above we are on the limit of this and may already be losing particles to the beampipe, especially just after exiting the buncher cavity 5. Kick as a function of distance off-centre These simulations were repeated for a range of different initial offsets and then the angle of the kick calculated using the change in average y position of the macroparticles. This is shown in Fig 5.1 and varies linearly as a function of initial offset. This only accounts beams entering the buncher on-angle. The final 10 mm point for 3D fieldmaps does not follow the trend because at this point some of the beam is outside the buncher aperture of 13 mm where the 3D fieldmap stops, however the 1D fieldmap has no boundary conditions. Fig 5.1: Vertical kick versus initial beam offset. Red dots are using 3D fieldmaps, blue using 1D fieldmaps initial offset [mm] 0 1 2 3 4 5 6 7 8 9 10 <y> [mm] 0.01107 1.274 2.538 3.802 5.067 6.329 7.594 8.857 10.12 11.34 12.36 <y> - offset [mm] 0.01107 0.274 0.538 0.802 1.067 1.329 1.594 1.857 2.12 2.34 2.36 angle [mrad] 0.0369 0.913333 1.793331 2.673327 3.556652 4.429971 5.313283 6.189921 7.066549 7.799842 7.866504 angle [degrees] 0.002114 0.05233 0.10275 0.15317 0.203781 0.253819 0.304429 0.354656 0.404883 0.446898 0.450718 References [1] [3] [2] [4] <\\apsv4\astec\Projects\4gls\ERLP\Machine operations\Alice injector modelling with stray fields v3.doc> Monika Balk, CST, private communication <\\apsv4\astec\Projects\4gls\ERLP\Machine operations\Baselines Inj 230kV, 4.8MeV v.01.pdf> Bas van der Geer, Pulsar Physics, private communication


