SOUTH AUSTRALIAN MATERNAL SERUM ANTENATAL
advertisement
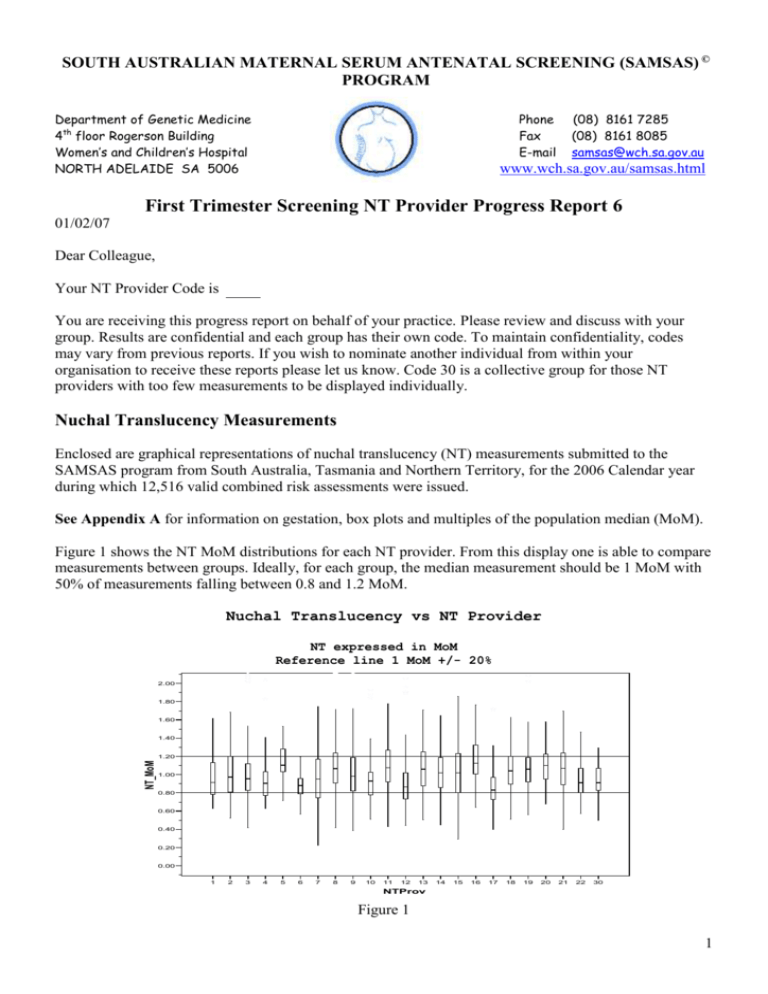
SOUTH AUSTRALIAN MATERNAL SERUM ANTENATAL SCREENING (SAMSAS) © PROGRAM Department of Genetic Medicine 4th floor Rogerson Building Women’s and Children’s Hospital NORTH ADELAIDE SA 5006 Phone Fax E-mail (08) 8161 7285 (08) 8161 8085 samsas@wch.sa.gov.au www.wch.sa.gov.au/samsas.html First Trimester Screening NT Provider Progress Report 6 01/02/07 Dear Colleague, Your NT Provider Code is You are receiving this progress report on behalf of your practice. Please review and discuss with your group. Results are confidential and each group has their own code. To maintain confidentiality, codes may vary from previous reports. If you wish to nominate another individual from within your organisation to receive these reports please let us know. Code 30 is a collective group for those NT providers with too few measurements to be displayed individually. Nuchal Translucency Measurements Enclosed are graphical representations of nuchal translucency (NT) measurements submitted to the SAMSAS program from South Australia, Tasmania and Northern Territory, for the 2006 Calendar year during which 12,516 valid combined risk assessments were issued. See Appendix A for information on gestation, box plots and multiples of the population median (MoM). Figure 1 shows the NT MoM distributions for each NT provider. From this display one is able to compare measurements between groups. Ideally, for each group, the median measurement should be 1 MoM with 50% of measurements falling between 0.8 and 1.2 MoM. Nuchal Translucency vs NT Provider NT expressed in MoM Reference line 1 MoM +/- 20% 2.00 1.80 1.60 1.40 NT_MoM 1.20 1.00 0.80 0.60 0.40 0.20 0.00 1 2 3 4 5 6 7 8 9 10 11 12 13 14 15 16 17 18 19 20 21 22 30 NTProv Figure 1 1 Table 1, shows the number of NT measurements performed by each group. NT Provider 1 2 3 4 5 6 7 8 9 10 11 12 Number of Measurements 36 214 3225 78 33 95 345 1918 1169 63 427 770 NT Provider 13 14 15 16 17 18 19 20 21 22 30 Total Number of Measurements 298 248 199 107 103 950 1865 125 138 77 33 12516 It is pleasing to see from figure 1 that all NT providers have acceptable distributions; however groups 12 and 17 are trending towards lower measurements. Lower than average measurements will result in an underestimate of risk. In order to provide a program of high quality, it is imperative that all NT providers follow the same measurement technique. The recommended method is taught by the RANZCOG run NT Ultrasound, Education & Monitoring Program and is discussed under “Newsletters” in their website, www.nuchaltrans.edu.au . This site contains information on training and accreditation programs, all provider groups are encouraged to have registered sonographers. In addition to accredited sonographers and the SAMSAS progress reports, quality assurance procedures within each practice are strongly recommended. Caution needs to be applied when making inferences about the quality of NT measurements, as ascertainment bias may result from either too few measurements or from screening practices which may preselect screened pregnancies based on either high or low NT measurements. It is however correct to say that strict adherence to the recommended method of measurement will minimise variability, lead to tighter population distributions and assist in maintaining program performance. This point can not be stressed strongly enough. Figure 2 shows the NT MoM distribution for all NT providers combined. It represents the overall population distribution of NT measurements and is a graphical representation of data in Table 2. We aim to keep the box between 1 MoM +/- 20%. Nuchal Translucency Distribution all Providers NT expressed in MoM Reference line 1 MoM +/- 20% 2.00 1.80 1.60 1.40 1.20 1.00 0.80 0.60 0.40 0.20 N = 12,516 0.00 NT_MoM Figure 2 2 Table 2 shows summary data of NT MoM’s for six NT progress reports. The data shows an improved IQR, suggesting less variability in measurements and coincides with the new measuring technique now being taught of zooming up the head and upper thorax. Refer to Newsletter 3, on the website www.nuchaltrans.edu.au and NT Progress Report 5, page 3. SAMSAS has made the necessary corrections to the NT median values. The stability displayed supports current practices and the continued use of NT in the screening program. Table 2 Number of NT Provider Groups Number of NT measurements Percentile 5th 25th 50th or Median 75th 95th Interquartile Range (IQR) Report 1 Dec’01 8 Report 2 May’03 12 Report 3 April’04 17 Report 4 April’05 17 Report 5 Jan’06 19 Report 6 Feb’07 23 1,845 2,465 8,198 8,727 10,832 12,516 MoM 0.6 0.82 0.99 1.19 1.62 0.37 MoM 0.59 0.82 1.0 1.22 1.63 0.4 MoM 0.61 0.83 1.01 1.21 1.63 0.38 MoM 0.62 0.83 1.00 1.20 1.60 0.37 MoM 0.64 0.85 1.03 1.23 1.62 0.38 MoM 0.66 0.86 1.0 1.17 1.55 0.31 For the 12,516 screens performed the median maternal age at delivery remained at 31.3yrs, the median gestation for blood samples at 12wks 2 days and 12wks 4 days for the nuchal translucency scans. Blood samples and nuchal translucency scans can be done on different days. It is preferable to have the blood sample collected before the NT scan. First Trimester Combined Screening Strategy Performance In 2006, 70% of all requests submitted to the SAMSAS program from South Australia, Tasmania and the Northern Territory were for first trimester screening. Audits for 2004 and 2005 for the SA population continue to demonstrate the improved performance of 1st trimester combined screening over the 2nd trimester screen. The comparative figures are as follows: First trimester screening. The median age of mothers screened in 1st trimester was 31.4 years. 5.1% were given an “at increased risk report” for Down syndrome. There were 43 cases of Down syndrome in this 1st trimester audited population and 39 of the 43 affected pregnancies were detected, resulting in a 90.7% detection rate. Second trimester screening. The median age of mothers screened was 29.1 years. 6.8% were given an “at increased risk report” for Down syndrome. There were 21 cases of Down syndrome within the audited 2nd trimester population and 13 of the 21 affected pregnancies were detected, resulting in a 61.9% detection rate. 3 Summary Sonography practices should have accredited sonographers and internal quality assurance procedures, to maintain the standard of their service. From a population screening perspective, the spread and stability of NT measurements continues to be acceptable. The combined screening strategy performance continues to be high and is the strategy of choice when screening for Down syndrome. SAMSAS is able to receive ultrasound reports electronically through Promedicus and E-clinic as Dr SAMSAS. Submitting reports electronically will assist in minimising delays with reporting. Could all groups review their practice of providing timely reports to SAMSAS; this does not apply to OACIS users as SAMSAS has direct access. Please contact Promedicus on 03 9426 9988 or E-clinic on 1300 669 961 for assistance. South Australia is in a unique position of offering centralised services for both maternal serum screening and cytogenetics. This results in effective program management and evaluation. I would like to thank all participants within this service network. Your continued cooperation and input have lead to the success of the program. The data presented and the performances quoted in this report are those of the SAMSAS program and do not apply to other software or testing centres. Progress reports are available on line, www.wch.sa.gov.au/samsas.html Yours sincerely, Robert Cocciolone, BAppSc, Med Lab Sc, Head, Antenatal Screening (SAMSAS) Program 4 Appendix A 1. SAMSAS uses crown rump length (CRL) at the time of the nuchal translucency (NT) scan to estimate gestation. From our curve shown below, (based on ASUM standards), a CRL of 43 mm corresponds to 11 wks 0 days with 81 mm being 13wks 6 days. If, when measuring the NT, the fetal position and image is optimal but the CRL is a few mm outside the above range, still measure and report the NT; chances are the blood sample is within the acceptable gestational age window. If in doubt please call us on 08 8161 7285. Our staff and SAMSAS software are primed to pick up discrepancies in submitted gestational age information; corrections are initiated before risk calculations. Gestational Age Curve CRL (mm) vs Days Lines represent NT screening window 11wks - 13wks6days 100 95 90 85 DAYS 80 75 70 40 45 50 55 60 65 70 75 80 85 CRL 2. 1st trimester blood samples are accepted from 10wks to 13wks 6 days; they DO NOT have to be collected on the same day as the nuchal scan. Any gestational age variations for blood samples will be automatically corrected back to the collection date once the NT report is received. The optimal time for the blood sample is 10-12 wks. 3. Most data presented in this report are in the form of Box Plots. A number N= is displayed on the X axis, this represents the number of measurements displayed in the box plot for the respective group. The Box includes the 25th to the 75th percentiles (or the interquartile range, IQR), with the median (or 50th percentile) being the line in the box. 50% of cases fall within the Box. The tails or whiskers at either end of the box display the smallest and largest observed values that are not outliers. From the length of the box you can determine the spread or variability of your measurements. If the Median value is not in the centre of the box, then your measurements are skewed. 4. Representing the NT measurements in multiples of the population median (MoM), eliminates variability from differences in gestational age. For example, 1 MoM at 11 weeks is directly comparable to 1 MoM at 12 weeks etc, whereas the respective measurements in mm would be different. 5

