Multiobjective Value Analysis: Decision Making
advertisement
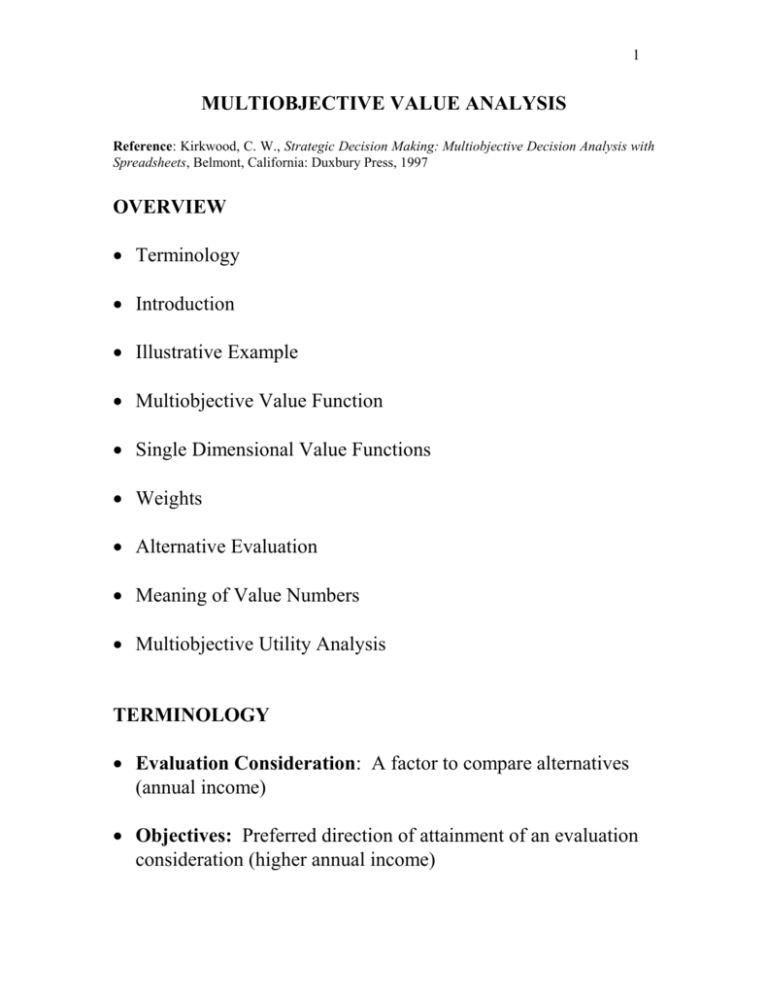
1 MULTIOBJECTIVE VALUE ANALYSIS Reference: Kirkwood, C. W., Strategic Decision Making: Multiobjective Decision Analysis with Spreadsheets, Belmont, California: Duxbury Press, 1997 OVERVIEW Terminology Introduction Illustrative Example Multiobjective Value Function Single Dimensional Value Functions Weights Alternative Evaluation Meaning of Value Numbers Multiobjective Utility Analysis TERMINOLOGY Evaluation Consideration: A factor to compare alternatives (annual income) Objectives: Preferred direction of attainment of an evaluation consideration (higher annual income) 2 Goal: Threshold of achievement (> $100K) Evaluation Measure: Scale to measure degree we attain an objective (annual salary in $) Also: MOE, MOM, or metric Level or score: specific numerical rating of the evaluation measure ($55K) Value Structure: Evaluation considerations, objectives, and evaluation measures Value Hierarchy (Value Tree): Pictorial representation of the structure of the evaluation considerations and evaluation measures Layer/Tier: Levels in the value hierarchy do not have to be symmetric Scoring function: A function that assigns value to an evaluation measure (single dimensional value function) Value Model: The entire value tree, weights, scoring functions -- everything necessary to mathematically evaluate a set of alternatives. INTRODUCTION Multiobjective Value Analysis Multiple, sometimes conflicting objectives No uncertainty about the outcomes 3 We need to obtain Evaluation considerations Evaluation measures Alternatives Alternative scores for each evaluation measure We want to rank alternatives and select the most preferred Develop a value function v (x ) w v (x ) n i 1 i i QUESTIONS: Define: x x i v( x) v (x ) i i w i i 4 EXAMPLE: SELECTING A NETWORK STRATEGY (EXPANDED), Kirkwood, pp. 54-55. Company deciding on a networking strategy for its personal computers. Three evaluation considerations and three evaluation measures selected Productivity enhancement, constructed scale Security, constructed scale Cost increase, net present value QUESTIONS: 1. What is a constructed scale? 2. Can you come up with direct, natural or proxy scales for the two evaluation measures with constructed scales? -1 0 1 2 Productivity Enhancement User group productivity is diminished … No change in user group productivity … User group productivity is enhanced ….. Significant & perceived increase …. -2 -1 0 1 Security Potentially serious decrease in system security …. Noticeable but acceptable decrease …. No detectable change in …. System security is enhanced ….. 5 The scores are given in the following matrix. Alternatives have been added to those listed in the Kirkwood. Evaluation Measures Productivity Cost Security, Xs Enhancement, Xp Increase, Xc Status Quo 0 0 0 High Qual/High Cost 2 125 0.5 Avg Qual/Avg Cost 1 110 0 Med Qual/Med Cost 1 95 0 Lower Qual/Lower Cost 1 100 -1 Low Qual/Low Cost 0.5 65 -1 QUESTIONS: 1. What role does the status quo play in the three scales? 2. Which alternatives are dominated? MULTIOBJECTIVE VALUE FUNCTION Tradeoffs between the evaluation measures must be made to determine the best alternative. We need a single index of overall “value” value function! 6 Approach # 1: Using Simple Averaging Take the average of each evaluation measure Status Quo High Qual/High Cost** Avg Qual/Avg Cost Med Qual/Med Cost Lower Qual/Lower Cost Low Qual/Low Cost Xp 0 2 1 1 1 0.5 Xc 0 125 110 95 100 65 Xs 0 0.5 0 0 -1 -1 Score 0 43 37 32 33 22 QUESTION: What is wrong with this approach? Approach # 2: Simple Average with Negative of Decreasing Evaluation Measures Status Quo High Qual/High Cost Avg Qual/Avg Cost Med Qual/Med Cost Lower Qual/Lower Cost Low Qual/Low Cost Xp 0 2 1 1 1 0.5 Xc 0 -125 -110 -95 -100 -65 QUESTION: What is wrong with this approach? Xs 0 0.5 0 0 -1 -1 Score 0 -41 -36 -31 -33 -22 7 The Problem of Units for Evaluation Measures The relative ratings of the alternatives should not change if we change the units used for the evaluation measure Suppose we measure the cost increase in $m instead of $k Status Quo High Qual/High Cost** Avg Qual/Avg Cost Med Qual/Med Cost Lower Qual/Lower Cost Low Qual/Low Cost Xp 0 2 1 1 1 0.5 Xc 0 -0.125 -0.11 -0.095 -0.1 -0.065 Xs 0 0.5 0 0 -1 -1 Score 0.00 0.79 0.30 0.30 -0.03 -0.19 Approach # 3 - Average the Normalized Scores One approach to overcoming the problem of units is to normalize the scores. This is a proportional score. If higher scores are preferred we use Rating = Score - Lowest Level Highest Level- Lowest Level If lower scores are preferred we use Rating = Highest Level - Score Highest Level - Lowest Level QUESTION: Calculate the score of High Cost/High Quality. 8 Here’s one of the three functions. Linear or Proportional Scoring 1.20 1.00 Score 0.80 0.60 0.40 0.20 0.00 -1.5 -1 -0.5 0 0.5 1 1.5 2 2.5 Productivity Enhancem ent Here’s the resulting scores. Status Quo High Qual/High Cost Avg Qual/Avg Cost Med Qual/Med Cost Lower Qual/Lower Cost Low Qual/Low Cost Xp 0.00 1.00 0.50 0.50 0.50 0.25 Xc 1.00 0.00 0.12 0.24 0.20 0.48 Xs 0.67 1.00 0.67 0.67 0.00 0.00 Score 0.56 0.67 0.43 0.47 0.23 0.24 We still have two problems 1. The scores on the evaluation measure depend on the range of variation. 2. We have assumed the variations are of equal importance. QUESTION: How can we solve these problems? 9 Using Weights for Evaluation Measures Weights solve both of these problems. Assume wp = 0.5, wc = 0.3, and ws = 0.2, we get Xp 0.00 1.00 0.50 0.50 0.50 0.25 0.5 Status Quo High Qual/High Cost Avg Qual/Avg Cost Med Qual/Med Cost Lower Qual/Lower Cost Low Qual/Low Cost Weights Xc 1.00 0.00 0.12 0.24 0.20 0.48 0.3 Xs 0.67 1.00 0.67 0.67 0.00 0.00 0.2 Score 0.43 0.70 0.42 0.46 0.31 0.27 Single Dimensional Value Functions Measure Returns to Scale Constant returns to scale (Linear) Decreasing returns to scale (Concave) Increasing returns to scale (Convex) Other, e.g., S-curve (a combination of the above) The Value Function v (x ) w v (x ) n i 1 i i i w 1 n i 1 i 10 QUESTION: What does the overall value function measure? DETERMINING THE SCORING FUNCTIONS (SINGLE DIMENSIONAL VALUE FUNCTIONS) * Single dimensional value functions measure returns to scale Usually scale all n functions 0 to 1 0 to 10 0 to 100 QUESTION: Why do we want to scale the functions this way? Kirkwood uses two types of functions because they are easy to use with a Spreadsheet and can handle qualitative evaluation measures piecewise linear exponential In my consulting and research, I have used more general curves Linear Concave Convex S-curve Using Logical Decisions you put in any data and the program will fit the curve Using DPL you can put in any functional form you can define 11 PIECEWISE LINEAR SINGLE DIMENSIONAL VALUE FUNCTIONS Kirkwood recommends piecewise linear when the evaluation measure has a small number of possible scoring levels (Discrete) -1 0 1 2 Productivity Enhancement User group productivity is diminished … No change in user group productivity … User group productivity is enhanced ….. Significant & perceived increase …. Kirkwood’s assessment technique uses relative value increments for each possible score Value increment = degree decision-maker prefers higher to lower score level QUESTION: What does the single dimensional value function look like if the 1st increment has twice the value of the 2nd and 3rd? 1 Value 0.8 0.6 0.4 0.2 0 -1 0 1 Productivity Enhancem ent 2 12 -2 -1 0 1 Security Potentially serious decrease in system security …. Noticeable but acceptable decrease …. No detectable change in …. System security is enhanced ….. QUESTION: What does the single dimensional value function look like if the 1st increment has three times the value of the 3rd and the 2nd increment has twice the value of the 3rd ? 1 Value 0.8 0.6 0.4 0.2 0 -2 -1 0 1 Security When I have continuous evaluation measures, I usually ask the decision-maker to directly assess the evaluation measure score that provides a specified value level, e.g., 10, 8, 3, 0. With a little practice, they can usually do this This doesn’t require any calculations Everyone can directly see the value 13 EXPONENTIAL SINGLE DIMENSIONAL VALUE FUNCTIONS Kirkwood recommends the exponential For monotonically increasing preferences over Xi , 1 exp[ ( x x ) / ] 1 exp[ ( x x ) / ] , v (x ) x x , otherwise x x L i i i H i i i L i i L i i i H L i i exp(y) represents the exponential function, ey Single dimensional value function scaled from [0,1] is the exponential constant Exponential value function for five values of Excel file: exponential value.xls Increasing Exponential Preferences 1.200 1.000 -1 0.800 Value -5 Infinity 0.600 5 1 0.400 0.200 0.000 0 1 2 3 4 5 6 Evaluation Measure 7 8 9 10 14 See Kirkwood for monotonically decreasing form To use the exponential we must find Realistic values of will be greater than 1/10 the range of the evaluation measure see plot above Usually find midvalue such that v(x) = 0.5, then we can solve for no closed form solution use Goal Seek in Excel Excel file: exponential value.xls Tools Goal Seek In exponential value.xls Block c47:e49 Use <control> <~> to view the equations Rho 100 x 3 v(x) =(1-EXP(-(D47/C47)))/(1-EXP(-10/C47)) v(x)=0.5 What is rho? QUESTION: Use Goal Seek to find ANSWER: Rho 5.540058 x 3 v(x) 0.500437672 v(x)=0.5 What is rho? if v(3)=0.5. 15 DETERMINING THE WEIGHTS Our value function is v (x ) w v (x ) n i 1 i i i w 1 n i 1 i Each single dimensional value function is scaled on [0,1] Assess the swing weights - the numerical importance - by swinging each attribute using w v ( x ; x ) v ( x ,... x , x , x ,... x ) i i 0 i 0 0 0 0 1 i 1 i i 1 n Swing Weights: Value Increment Procedure 1. Place each evaluation measure in order - smallest to largest value increment 2. Scale each weight as a multiple of the smallest value increment (weight) 3. Sum the weights to one and solve for the weights NETWORKING EXAMPLE 1. Value increments Smallest: Productivity Enhancement Middle: Cost Largest: Security 16 2. wc = 1.5 wp and ws = 1.25wc 3. Solve for the weights Many times we assess weights using a group of people It is easier to have each person spread 100 points among the evaluation considerations. This usually requires discussions and revotes Group Weights Procedure: Spreading 100 Points 1. Have each individual spread 100 points over the evaluation measures. 2. Calculate the average weights 3. Discuss any significant differences 4. Revote 5. Go to step 2 until consensus is reached EXAMPLE 1 Our class has three evaluation measures: Homework Midterm Final Use the group weights procedure to develop weights for a course grade value function. CLASS EXAMPLE 2 – Trick Question 17 You have decided to buy a laptop for your office. The evaluation measures are cost, speed, and storage. Use the group weights procedure to develop weights for laptop evaluation value function. DETERMINING THE OVERALL VALUE OF THE ALTERNATIVES Finally, we use single dimensional value functions and the weights to obtain the overall score of each alternative Status Quo High Qual/High Cost Med Qual/Med Cost Low Qual/Low Cost Xp 0 2 1 0.5 Xc 0 125 95 65 Xs 0 0.5 0 -1 Status Quo** High Qual/High Cost Med Qual/Med Cost Low Qual/Low Cost Weights Xp 0.5 1 0.75 0.63 0.22 Xc 1 0.23 0.46 0.66 0.35 Xs 0.83 0.92 0.83 0.5 0.43 MEANING OF THE VALUE NUMBERS QUESTIONS 1. What do the value numbers mean? 2. What is the meaning of the Status Quo score of 0.82? Score 0.82 0.70 0.68 0.58 18 3. Do the overall scores have meaning apart from the ranges of the evaluation measures? First, we define the hypothetical worst and best possible alternatives x0 = (-1, 150,-2) x* = (2, 0,1) The value increment, v(x*) - v(x0 ) = 1 Status Quo value of 0.82 means Status Quo alternative obtains 82% of the hypothetical value increment MULTIOBJECTIVE UTILITY ANALYSIS Above analysis was multiobjective value analysis Value functions measure returns to scale QUESTIONS 1. What do utility functions measure? 2. How do we obtain utility functions? 3. Are utility functions different from value functions? Multiobjective utility analysis (assuming the conditions for an additive multiobjective utility function are met) Assess utility functions using lotteries Assess weights Calculate expected utility of alternatives 19 SUMMARY Introduction to multiobjective value analysis Terminology Multiobjective Value Function Single Dimensional Value Functions Weights Alternative Evaluation Meaning of Value Numbers Brief comments on multiobjective utility MAT 647, MULTIOBJECTIVE DECISION ANALYSIS More on the applications and theory Multiobjective Value Multiobjective Utility Solution using spreadsheet macros


