abstract_sup_doc - U-System
advertisement
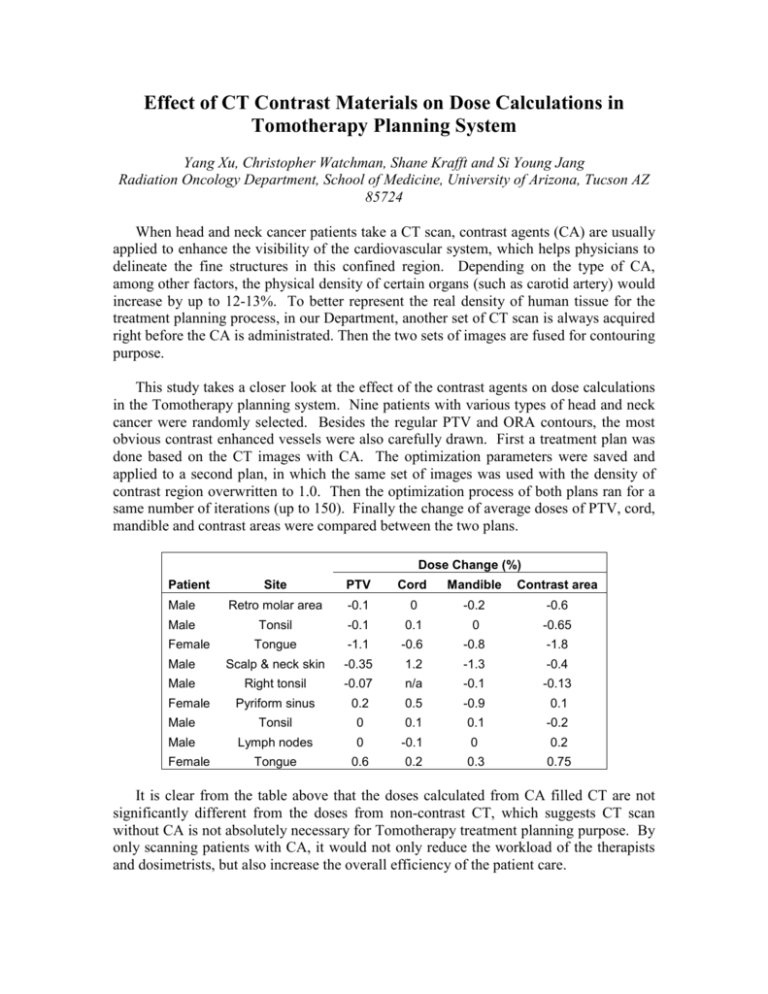
Effect of CT Contrast Materials on Dose Calculations in Tomotherapy Planning System Yang Xu, Christopher Watchman, Shane Krafft and Si Young Jang Radiation Oncology Department, School of Medicine, University of Arizona, Tucson AZ 85724 When head and neck cancer patients take a CT scan, contrast agents (CA) are usually applied to enhance the visibility of the cardiovascular system, which helps physicians to delineate the fine structures in this confined region. Depending on the type of CA, among other factors, the physical density of certain organs (such as carotid artery) would increase by up to 12-13%. To better represent the real density of human tissue for the treatment planning process, in our Department, another set of CT scan is always acquired right before the CA is administrated. Then the two sets of images are fused for contouring purpose. This study takes a closer look at the effect of the contrast agents on dose calculations in the Tomotherapy planning system. Nine patients with various types of head and neck cancer were randomly selected. Besides the regular PTV and ORA contours, the most obvious contrast enhanced vessels were also carefully drawn. First a treatment plan was done based on the CT images with CA. The optimization parameters were saved and applied to a second plan, in which the same set of images was used with the density of contrast region overwritten to 1.0. Then the optimization process of both plans ran for a same number of iterations (up to 150). Finally the change of average doses of PTV, cord, mandible and contrast areas were compared between the two plans. Dose Change (%) Patient Site PTV Cord Mandible Contrast area Male Retro molar area -0.1 0 -0.2 -0.6 Male Tonsil -0.1 0.1 0 -0.65 Tongue -1.1 -0.6 -0.8 -1.8 Male Scalp & neck skin -0.35 1.2 -1.3 -0.4 Male Right tonsil -0.07 n/a -0.1 -0.13 Female Female Pyriform sinus 0.2 0.5 -0.9 0.1 Male Tonsil 0 0.1 0.1 -0.2 Male Lymph nodes 0 -0.1 0 0.2 Tongue 0.6 0.2 0.3 0.75 Female It is clear from the table above that the doses calculated from CA filled CT are not significantly different from the doses from non-contrast CT, which suggests CT scan without CA is not absolutely necessary for Tomotherapy treatment planning purpose. By only scanning patients with CA, it would not only reduce the workload of the therapists and dosimetrists, but also increase the overall efficiency of the patient care. Patient Disease Site Average Density of CA Filled Area Male Retro molar area 1.14 Male Tonsil 1.13 Female Tongue 1.20 Male Scalp & neck skin 1.20 Male Right tonsil 1.14 Female Pyriform sinus 1.18 Male Tonsil 1.13 Male Lymph nodes 1.09 Female Tongue 1.11 Dose Change (%) Patient Site PTV Cord Mandible Contrast area Male Retro molar area -0.1 0 -0.2 -0.6 Male Tonsil -0.1 0.1 0 -0.65 Tongue -1.1 -0.6 -0.8 -1.8 Male Scalp & neck skin -0.35 1.2 -1.3 -0.4 Male Right tonsil -0.07 n/a -0.1 -0.13 Pyriform sinus 0.2 0.5 -0.9 0.1 Male Tonsil 0 0.1 0.1 -0.2 Male Lymph nodes 0 -0.1 0 0.2 Tongue 0.6 0.2 0.3 0.75 Female Female Female
