Details of biological studies
advertisement
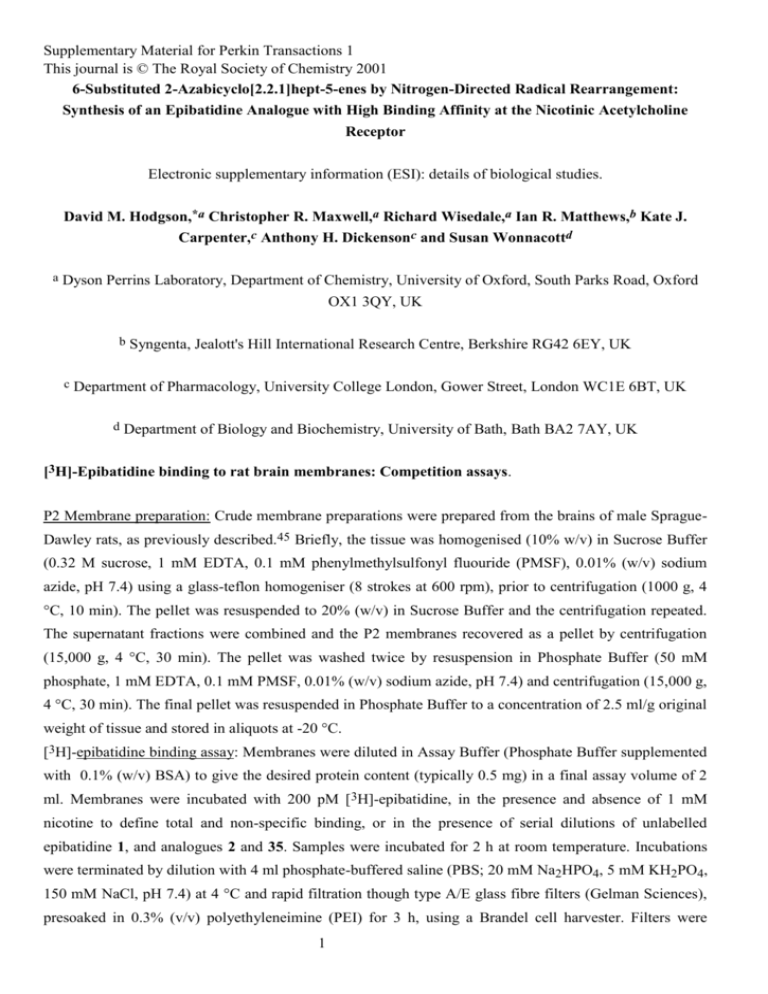
Supplementary Material for Perkin Transactions 1 This journal is © The Royal Society of Chemistry 2001 6-Substituted 2-Azabicyclo[2.2.1]hept-5-enes by Nitrogen-Directed Radical Rearrangement: Synthesis of an Epibatidine Analogue with High Binding Affinity at the Nicotinic Acetylcholine Receptor Electronic supplementary information (ESI): details of biological studies. David M. Hodgson,*a Christopher R. Maxwell,a Richard Wisedale,a Ian R. Matthews,b Kate J. Carpenter,c Anthony H. Dickensonc and Susan Wonnacottd a Dyson Perrins Laboratory, Department of Chemistry, University of Oxford, South Parks Road, Oxford OX1 3QY, UK b c Syngenta, Jealott's Hill International Research Centre, Berkshire RG42 6EY, UK Department of Pharmacology, University College London, Gower Street, London WC1E 6BT, UK d Department of Biology and Biochemistry, University of Bath, Bath BA2 7AY, UK [3H]-Epibatidine binding to rat brain membranes: Competition assays. P2 Membrane preparation: Crude membrane preparations were prepared from the brains of male SpragueDawley rats, as previously described.45 Briefly, the tissue was homogenised (10% w/v) in Sucrose Buffer (0.32 M sucrose, 1 mM EDTA, 0.1 mM phenylmethylsulfonyl fluouride (PMSF), 0.01% (w/v) sodium azide, pH 7.4) using a glass-teflon homogeniser (8 strokes at 600 rpm), prior to centrifugation (1000 g, 4 °C, 10 min). The pellet was resuspended to 20% (w/v) in Sucrose Buffer and the centrifugation repeated. The supernatant fractions were combined and the P2 membranes recovered as a pellet by centrifugation (15,000 g, 4 °C, 30 min). The pellet was washed twice by resuspension in Phosphate Buffer (50 mM phosphate, 1 mM EDTA, 0.1 mM PMSF, 0.01% (w/v) sodium azide, pH 7.4) and centrifugation (15,000 g, 4 °C, 30 min). The final pellet was resuspended in Phosphate Buffer to a concentration of 2.5 ml/g original weight of tissue and stored in aliquots at -20 °C. [3H]-epibatidine binding assay: Membranes were diluted in Assay Buffer (Phosphate Buffer supplemented with 0.1% (w/v) BSA) to give the desired protein content (typically 0.5 mg) in a final assay volume of 2 ml. Membranes were incubated with 200 pM [3H]-epibatidine, in the presence and absence of 1 mM nicotine to define total and non-specific binding, or in the presence of serial dilutions of unlabelled epibatidine 1, and analogues 2 and 35. Samples were incubated for 2 h at room temperature. Incubations were terminated by dilution with 4 ml phosphate-buffered saline (PBS; 20 mM Na2HPO4, 5 mM KH2PO4, 150 mM NaCl, pH 7.4) at 4 °C and rapid filtration though type A/E glass fibre filters (Gelman Sciences), presoaked in 0.3% (v/v) polyethyleneimine (PEI) for 3 h, using a Brandel cell harvester. Filters were 1 Supplementary Material for Perkin Transactions 1 This journal is © The Royal Society of Chemistry 2001 washed twice with 4 ml PBS at 4 °C and bound radioactivity determined by liquid scintillation spectrometry (counting efficiency 45%). Data analysis: IC50 values (concentration of drug that inhibits 50% of binding) were calculated by nonlinear regression of the specific binding data from competition binding assays, fitting to the Hill Equation, % bound = 100% / (1+([L]/IC50)n), where n is the Hill number (nH) and [L] is the concentration of displacing ligand. Ki values were calculated from IC50 values using the Cheng and Prussoff equation,46 assuming a Kd value for [3H]-epibatidine of 40 pM. Curve-fitting was performed using SigmaPlot V2.0 for Windows (Jandel Scientific). 100 H]-epibatidine binding (% maximum) 3[ 1 2 35 80 60 40 20 0 -13 -12 -11 -10 -9 -8 -7 -6 -5 Log10 [drug] Fig. 3. [3H]-epibatidine binding to rat brain P2 membranes, competition assays The inhibition of binding of 200 pM [3H]-epibatidine to rat brain P2 membranes by serial dilutions of epibatidine 1, and analogues 2 and 35 is shown. Data points (mean s.e.m. from three experiments) are fitted to the Hill equation. IC 50 Ki Ki [3H]-Epibatidine K i [3H]-Cytisine Ki ( 42 re ceptors )3b Epi bati dine 0.155 nM 0.026 nM Nicotin e An alog ue 2 1.3 nM 0.22 n M Epi bati dine 0.042 nM An alog ue 35 4.2 n M 0.7 nM ABT-594 0.037 nM 2 1.0 nM Supplementary Material for Perkin Transactions 1 This journal is © The Royal Society of Chemistry 2001 Electrophysiological studies of (+)-2 and ()-2 The techniques used here have been described more fully elesewhere.40 Male Sprague-Dawley rats (200– 250 g) were anaesthetised with 2-3% halothane (in 66% N2O and 33% O2) and subsequently maintained at 1.8% halothane. Core temperature of the animal was monitored using a rectal thermometer probe coupled to a heating blanket. At the end of the experiment, animals were terminated with overdose of anaesthetic. A laminectomy was performed to expose the segments L4–L5 of the spinal cord, and a parylene-coated tungsten electrode was descended into the dorsal horn using an Epson Stepper device. The depth of the recording site was noted from the microdrive readings. Extracellular recordings were made from single dorsal horn neurones receiving C- and A-fibre input from the skin of the hindpaw, identified by their ability to respond to both noxious and innocuous stimuli (pinch and touch). Neuronal responses were elicited by transcutaneous electrical stimulation given in the centre of the receptive field of the neurone in the ipsilateral hindpaw, at 3 times the threshold current required for C-fibre evoked activity. At 10-minute intervals, tests consisting of a train of 16 stimuli (2msec-wide pulses at 0.5 Hz) were carried out and poststimulus histograms constructed. These evoked response were separated, according to latency, into Afibre evoked activity (0–20 msec post-stimulus); A-fibre evoked activity (20–90 msec); C-fibre evoked activity (90–300 msec) and post-discharge of the neurone (300–800 msec). The neuronal response evoked by the first stimulus of the train is referred to as “input” and consists of the number of action potentials (90–800msec) evoked by this stimulus. Wind-up, a measure of the enhanced neuronal response elicited by repetitive stimulation, was quantified as the difference between the total number of action potentials produced by the 16 stimuli (90–800 ms), and the input 16. Thus the measure of wind-up includes both the enhanced C-fibre evoked responses and the post-discharge generated as wind-up develops. Tests were performed at 10-minute intervals, until the neuronal responses evoked at each test differed by less than 10%. The results of the last three tests were then averaged to give control values for each parameter. Cumulative doses of each epibatidine analogue [(+)-2 and ()-2] (0.5, 5 and 50g in 50l saline) were then applied to the exposed spinal cord into a ‘well’ formed by the laminectomy which held the 50l volume of drug. The electrically-evoked neuronal responses were followed for 60 minutes after each dose, after which the solution was removed and the next dose applied. The effect of analogue (+)-2 was tested on 7 individual neurones; analogue ()-2 was tested on 5 individual neurones. Data below are shown as percentage of pre-drug control values, with a 60 minute time-course for each dose of the drug. To generate a dose response curve, the maximum effects of each dose on each neurone were averaged. Data are presented as mean s.e.m. The results clearly show a dose-dependent inhibition of wind-up and post discharge, measures of post synaptic neuronal hyperexcitability in response to C-fibre evoked noxious stimulation and an inhibition of input onto the neurones, an index of neurotransmitter release. This dual effect was seen for the population of neurones and is clearly illustrated in the individual example (page 6) where the initial response of the neurone is reduced as is the enhanced response seen as the stimulation continues. This profile is very similar to that seen with another epibatidine analogue.3 The spinal route of administration of (+)-2 confirms this area as a key site in the antinociceptive effects of these nicotinic agents, The marked effects of (+)-2 contrast with those of ()-2. The interpretation that either ()-2 does not bind or it is too weak to activate and then desensitise the receptor, is supported by the fact that (+)-2 facilitated the neuronal responses at low doses yet as the dose increased clear inhibitions were produced whereas ()-2 only enhanced the responses. 3 Supplementary Material for Perkin Transactions 1 This journal is © The Royal Society of Chemistry 2001 Electrophysiological data for (+)-2 C-fibres 10' Day1 83 Day1 107 Day2 101 Day3 day4 102 Day5 86 Day5 76 Mean 93 Post Discharge 10' Day1 82 Day1 133 Day2 108 Day3 Day4 108 Day5 112 Day5 129 Mean 112 Input 10' Day1 Day1 187 Day2 88 Day3 Day4 129 Day5 Day6 143 Mean 137 20' 84 96 96 90 103 98 80 92 0.5ug 30' 73 92 95 114 105 104 91 96 20' 69 148 128 187 107 128 91 123 0.5ug 30' 56 139 122 162 100 129 84 113 40' 71 105 102 119 101 106 84 98 40' 49 123 121 146 97 122 80 105 0.5ug 20' 30' 40' 204 138 133 129 116 64 131 XS-Spikes 149 171 121 112 124 99 129 128 157 136 100 142 69 122 50' 66 110 107 117 89 98 50' 40 145 110 130 87 102 50' 60' 10' 20' 50ug 30' 40' 50' 60' 104 73 108 99 73 105 97 80 103 95 92 101 83 98 100 91 91 93 78 93 84 77 67 80 72 53 75 60 60 74 55 61 72 60 57 75 97 71 91 86 69 86.4 109 84 94.6 110 79 95 110 76 93 106 81 92 103 73 86 103 74 80 107 69 75 98 62 71 96 98 71 73 10' 20' 5ug 30' 40' 50' 60' 10' 20' 50ug 30' 40' 50' 60' 132 95 134 111 125 127 115 113 111 98 118 113 63 117 104 92 94 86 69 90 90 58 44 66 47 28 48 39 36 54 15 34 58 33 35 59 113 69 109 96 64 104.6 128 66 106.6 131 83 109 129 75 98 118 91 96 100 90 88 88 61 63 98 71 58 78 66 55 80 86 47 53 40' 50' 60' 10' 20' 50ug 30' 40' 50' 60' 20' 149 133 126 149 148 140 152 119 123 171 109 128 167 117 94 200 93 89 20 117 123 152 95 85 133 91 68 86 74 72 76 51 51 81 47 55 67 51 55 67 53 160 84 135 142 69 124 107 79 117.8 124 79 123 169 69 125 147 74 89 138 89 119 129 69 101 98 64 78 116 64 76 87 54 64 80 80 63 64 60' 57 105 63 10' 20' 5ug 30' 40' 50' 60' 10' 20' 50ug 30' 40' 50' 60' 96 34 99 86 38 118 87 34 51 91 25 145 91 31 27 68 39 93 69 51 78 63 29 71 50 10 116 47 20 141 25 29 124 41 27 124 112 89 85 89 79 79 84 60 77.2 112 76 72 101 119 96 107 85 68 100 78 76 89 108 79 91 83 67 94 86 71 93 91 78 97 93 69 71 60' 63 135 120 10' 20' 5ug 30' 40' 50' 60' 10' 20' 50ug 30' 40' 50' 60' 131 104 148 107 80 157 127 94 138 92 109 142 69 159 126 95 120 114 52 159 101 35 101 84 19 77 68 15 72 75 6 88 71 19 76 88 122 110 79 116 81 106.3 102 115.3 104 112 102 114 96 106 96 102 91 78 96 65 84 62 83 62 88 68 60' 73 88 133 10' 20' 5ug 30' 40' 50' 60' 10' 20' 50ug 30' 40' 50' 60' 79 121 159 85 115 159 79 119 159 80 131 154 90 128 154 81 126 160 68 126 162 84 121 140 87 110 129 69 93 134 75 103 141 69 96 127 100 66 105 89 66 102.8 96 87 108 96 81 108 99 68 108 96 77 108 96 60 102 91 77 103 98 68 98 98 68 92 101 94 105 97 10' 20' 5ug 30' 40' 50' 60' 10' 20' 50ug 30' 40' 50' 60' 104 109 178 101 94 163 108 97 154 86 98 164 94 109 136 83 99 140 78 103 111 84 106 102 81 94 70 76 85 80 71 85 89 63 87 104 112 94 119 113 105 115.2 114 107 116 114 97 112 108 110 111 109 94 105 96 88 95 88 91 94 83 99 85 89 102 86 91 84 84 85 89 124 40' 64 136 79 158 105 97 107 50' 69 150 110 157 10' Day1 85 Day1 88 Day2 102 Day3 Day4 114 Day5 100 Day6 56 Mean 91 20' 89 85 100 130 100 101 48 93 0.5ug 30' 87 71 103 164 104 103 81 102 40' 79 92 114 176 96 104 76 105 50' 82 86 124 181 A-beta-low 0.5ug 20' 30' 40' 94 57 145 135 114 111 108 102 172 198 188 114 93 100 110 113 105 75 94 99 117 124 109 10' Day1 90 Day1 124 Day2 106 Day3 Day4 78 Day5 121 Day6 91 Mean 102 40' 10' 0.5ug 30' 64 151 88 162 95 95 109 A-beta-high 130 88 102 5ug 30' 60' 20' 84 146 88 141 102 77 106 10' Day1 94 Day1 155 Day2 94 Day3 Day4 104 Day5 89 Mean 107 60' 37 140 114 20' 50' 0.5ug 30' 40' 61 0 102 98 53 70 169 95 99 98 111 102 66 124 94 84 A-delta 123 77 95 10' 5ug 30' 20' 64 68 80 85 102 111 145 94 10' Day1 106 Day1 77 Day2 111 Day3 Day4 101 Day5 Day6 Mean 99 60' 62 113 99 50' 0 107 81 96 91 75 122 79 110 50' 80 109 99 189 80 111 120 85 100 60' 67 113 96 115 86 95 4 % Control % Control % Control % Control % Control % Control % Control Supplementary Material for Perkin Transactions 1 This journal is © The Royal Society of Chemistry 2001 5 Supplementary Material for Perkin Transactions 1 This journal is © The Royal Society of Chemistry 2001 Electrophysiological data for ()-2 C-fibres 10' 107 91 106 110 116 106 20' 105 87 63 99 108 92 0.5ug 30' 114 97 104 111 117 109 40' 118 100 96 112 114 108 50' 123 100 89 114 114 108 60' 118 95 96 122 Post Discharge 10' Day1 121 Day2 79 Day3 152 Day4 338 Day5 139 Mean 166 20' 146 104 72 433 125 176 0.5ug 30' 162 119 143 343 164 186 40' 156 113 112 287 157 165 50' 188 108 93 206 100 139 60' 168 109 111 251 10' 120 87 100 95 120 104 20' 103 96 100 88 113 100 0.5ug 30' 140 111 113 102 120 117 40' 128 101 107 102 140 116 50' 148 120 127 95 127 123 60' 124 120 107 109 10' 94 101 115 356 118 157 20' 140 114 108 421 105 178 0.5ug 30' 106 102 101 344 129 156 40' 132 119 80 284 89 141 50' 132 73 76 259 89 126 60' 146 67 84 261 10' 125 99 121 121 94 112 20' 88 101 57 121 90 91 0.5ug 30' 88 119 139 131 101 116 40' 194 113 105 128 89 126 50' 150 117 67 97 90 104 60' 113 107 102 123 10 95 89 72 138 98 84 20 104 87 44 57 ### ### 0.5ug 30 104 87 76 122 107 88 40 108 83 72 98 106 85 50 108 90 127 114 108 100 60 109 81 65 106 10' Day1 108 Day2 100 Day3 60 Day4 Day5 94 Mean 91 20' 106 100 56 0.5ug 30' 119 102 52 40' 116 90 53 50' 106 99 44 60' 102 91 49 112 94 76 87 88 87 87 84 81 Day1 Day2 Day3 Day4 Day5 Mean Input Day1 Day2 Day3 Day4 Day5 Mean XS-Spikes Day1 Day2 Day3 Day4 Day5 Mean A-delta Day1 Day2 Day3 Day4 Day5 Mean A-beta-high Day1 Day2 Day3 Day4 Day5 Mean A-beta-low 108 160 115 140 111 84 20' 120 96 96 109 105 105 5ug 30' 124 96 94 112 104 106 40' 130 96 92 123 107 110 50' 133 94 90 109 95 104 60' 128 99 81 105 10' 118 100 97 90 20' 133 101 99 81 103 101 104 20' 208 143 158 398 220 225 5ug 30' 274 124 180 263 191 206 40' 288 111 173 223 177 194 50' 274 108 149 101 114 149 60' 243 105 98 99 10' 182 110 139 51 20' 244 106 162 43 136 121 139 119 20' 148 118 127 110 120 125 5ug 30' 136 134 147 102 120 128 40' 169 118 127 150 120 137 50' 173 115 120 88 107 121 60' 140 120 100 88 10' 136 120 133 68 20' 165 115 153 61 112 114 124 20' 139 131 94 347 126 167 5ug 30' 220 64 90 277 116 153 40' 184 76 97 91 112 112 50' 174 75 87 181 81 120 60' 194 69 67 162 10' 137 77 81 140 20' 166 82 83 140 123 109 118 20' 156 127 134 100 79 119 5ug 30' 150 114 114 108 89 115 40' 206 116 116 105 76 124 50' 181 113 120 82 76 114 60' 113 107 75 77 10' 125 114 134 59 20' 169 109 145 33 93 108 114 20 107 81 63 57 97 71 5ug 30 112 77 59 89 94 77 40 116 80 57 122 102 86 50 115 80 56 130 60 82 60 118 82 53 130 10 108 83 59 122 20 118 75 53 65 89 76 66 49 20' 127 72 54 5ug 30' 133 76 66 40' 135 82 52 50' 129 75 52 60' 146 79 50 10' 117 85 51 20' 121 87 50 94 86.7 120 93 100 94 92 90 112 92 92 84 86 10' 120 99 104 109 108 10' 174 123 283 141 180 10' 136 153 95 114 125 10' 134 70 346 107 164 10' 113 116 92 85 102 10 105 65 114 106 80 10' 117 6 50ug 30' 40' 121 123 98 93 102 103 74 36 50' 122 95 101 71 60' 124 100 104 55 89 97 96 50ug 30' 40' 187 161 106 98 154 151 30 9 50' 132 73 149 15 60' 135 93 146 4 105 92 94 50ug 30' 153 115 173 61 40' 144 115 147 41 50' 124 87 127 48 60' 120 94 127 34 126 112 97 94 50ug 30' 40' 121 117 77 58 71 85 82 101 50' 143 77 93 111 60' 157 102 93 91 90 106 111 50ug 30' 40' 113 63 109 107 143 136 26 28 50' 63 103 141 21 60' 56 100 139 21 84 82 79 50ug 30 40 109 109 88 80 52 56 41 33 50 110 87 58 49 60 110 82 65 8 64 71 65 50ug 30' 40' 117 110 80 87 51 54 50' 114 81 53 60' 111 77 52 83 80 99 88 98 64 83 84 % Control % Control % Control % Control % Control % Control % Control Supplementary Material for Perkin Transactions 1 This journal is © The Royal Society of Chemistry 2001 References 45 A. R. L. Davies, D. J. Hardick, I. S. Blagbrough, B. V. L. Potter, A. J. Wolstenholme and S. Wonnacott, Neuropharmacol., 1999, 38, 679. 46 Y.-C. Cheng and W. H. Prussof, Biochem. Pharmacol.,1973, 22, 3099. 7
