Teacher`s Notes - University of California, Irvine
advertisement
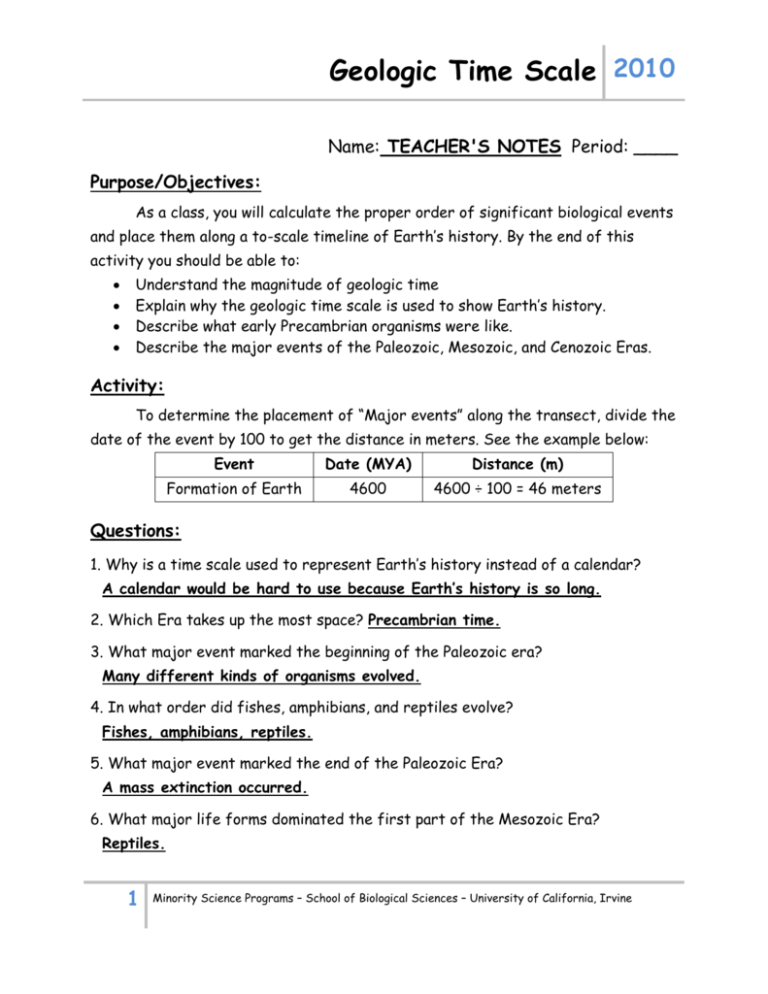
Geologic Time Scale 2010 Name: TEACHER'S NOTES Period: ____ Purpose/Objectives: As a class, you will calculate the proper order of significant biological events and place them along a to-scale timeline of Earth’s history. By the end of this activity you should be able to: Understand the magnitude of geologic time Explain why the geologic time scale is used to show Earth’s history. Describe what early Precambrian organisms were like. Describe the major events of the Paleozoic, Mesozoic, and Cenozoic Eras. Activity: To determine the placement of “Major events” along the transect, divide the date of the event by 100 to get the distance in meters. See the example below: Event Date (MYA) Distance (m) Formation of Earth 4600 4600 ÷ 100 = 46 meters Questions: 1. Why is a time scale used to represent Earth’s history instead of a calendar? A calendar would be hard to use because Earth’s history is so long. 2. Which Era takes up the most space? Precambrian time. 3. What major event marked the beginning of the Paleozoic era? Many different kinds of organisms evolved. 4. In what order did fishes, amphibians, and reptiles evolve? Fishes, amphibians, reptiles. 5. What major event marked the end of the Paleozoic Era? A mass extinction occurred. 6. What major life forms dominated the first part of the Mesozoic Era? Reptiles. 1 Minority Science Programs – School of Biological Sciences – University of California, Irvine Geologic Time Scale 2010 Major Events Table: Event Date (million years ago) Distance (meters) Precambrian Formation of Earth 4600 46 Precambrian Origin of life (Bacteria) 3500 35 Precambrian First multicellular organisms 1000 10 Precambrian First green algae (plants) 700 7 Precambrian First animals (sponges & jellies) 600 6 Era Period Paleozoic Cambrian Cambrian Explosion (many invertebrate sea animals evolved at once) 543 5.43 Paleozoic Ordovician First fishes (jawless) 455 4.55 Paleozoic Silurian Ordivician extinction (2nd most devastating extinction to marine life) 440 4.40 Paleozoic Devonian First land plants (mosses) 400 4 Paleozoic Devonian First insects 396 3.96 Paleozoic Devonian First land vertebrates (amphibians) 365 3.65 Paleozoic Devonian First seed plants 362 3.62 Paleozoic Devonian Devonian extinction (marine invertebrates) 360 3.6 Paleozoic Carboniferous First ancestors of reptiles & birds 340 3.4 Paleozoic Permian First ancestors of mammals 285 2.85 Paleozoic Permian Permian extinction (90% of all life dies off; major terrestrial extinctions) 245 2.45 Mesozoic Triassic First dinosaurs 225 2.25 Mesozoic Jurassic First mammals 200 2 Mesozoic Jurassic First birds 150 1.5 Mesozoic Cretaceous First flowering plants 85 0.85 Mesozoic Cretaceous Cretaceous-Tertiary (K-T) extinction 65 0.65 Cenozoic Tertiary First primates (monkeys) 55 0.55 Cenozoic Tertiary First apes 30 0.3 Cenozoic Quaternary Homo sapiens evolves 0.1 0.001 Cenozoic Quaternary Today 0 0 2 Minority Science Programs – School of Biological Sciences – University of California, Irvine Geologic Time Scale 2010 ACTIVITY INSTRUCTIONS: Prepare a class set of note cards that include the name of each significant biological event on one side and the corresponding date (and distance) on the reverse side. Lay down a 50-meter transect or tape measure outside the classroom to function as the timeline. Introduce the activity by discussing timelines (we referenced the “Biological Events” timeline from their book), emphasizing that many timelines are not drawn to scale. Explain that you will work as a class to create a to scale timeline of Earth’s History. After the students have completed all the distance calculations themselves, distribute the note cards so that each student has one event. Explain the orientation of the timeline, and then ask each student to place his or her event at the correct location. Once all the events are placed, walk as a class from one end of the timeline to the other to observe the proportional passage of time between events. Ask the students for their observations. If you have more students than events, you can make cards to mark the beginning and end of each Era. Assign some students to stand behind the timeline holding these markers while the others place their events at the correct location. 3 Minority Science Programs – School of Biological Sciences – University of California, Irvine
