Content addressed - Cochrane Training
advertisement
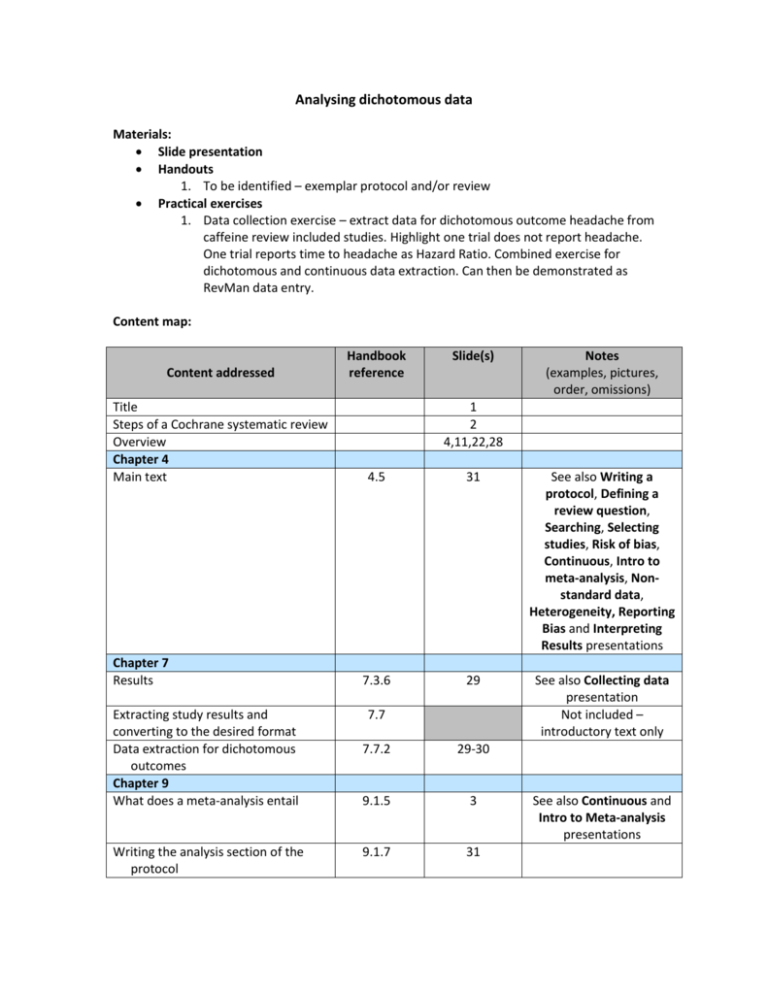
Analysing dichotomous data Materials: Slide presentation Handouts 1. To be identified – exemplar protocol and/or review Practical exercises 1. Data collection exercise – extract data for dichotomous outcome headache from caffeine review included studies. Highlight one trial does not report headache. One trial reports time to headache as Hazard Ratio. Combined exercise for dichotomous and continuous data extraction. Can then be demonstrated as RevMan data entry. Content map: Content addressed Title Steps of a Cochrane systematic review Overview Chapter 4 Main text Chapter 7 Results Extracting study results and converting to the desired format Data extraction for dichotomous outcomes Chapter 9 What does a meta-analysis entail Writing the analysis section of the protocol Handbook reference Slide(s) Notes (examples, pictures, order, omissions) 1 2 4,11,22,28 4.5 31 See also Writing a protocol, Defining a review question, Searching, Selecting studies, Risk of bias, Continuous, Intro to meta-analysis, Nonstandard data, Heterogeneity, Reporting Bias and Interpreting Results presentations 7.3.6 29 See also Collecting data presentation Not included – introductory text only 7.7 7.7.2 29-30 9.1.5 3 9.1.7 31 See also Continuous and Intro to Meta-analysis presentations Types of data 9.2.1 5 Effect measures for dichotomous outcomes Calculation of RR, OR, RD from a 2x2 table Risk and odds Measures of relative effect the risk ratio and odds ratio Warning: OR and RR are not the same Measures of absolute effect (RD) What is the event? Principles of meta-analysis Meta-analysis of dichotomous outcomes 9.2.2 5,13 Box 9.2.a 12,14,16,18 9.2.2.1 9.2.2.2 6-10 13-17,20-21 9.2.2.3 17 9.2.2.4 9.2.2.5 9.4.2 9.4.4 9.4.4.1 9.4.4.2 9.4.4.3 9.4.4.4 9.4.6 13,18-19 14-17,26 3 Effect measure Combining dichotomous and continuous data Chapter 12 Interpreting results from dichotomous outcomes (including numbers needed to treat) Relative and absolute risk reductions More about the number needed to treat (NNT) Expressing absolute risk reductions Computations Computing NNT from a risk difference (RD) Computing absolute risk reduction or NNT from a risk ratio (RR) Computer absolute risk reduction or NNT from an odds ratio (OR) Computing risk ratio from an odds ratio Computing confidence limits Take home message Acknowledgements See also Continuous and Non-standard presentations Notes only See Meta-analysis and Non-standard presentations 23-27 Not included 12.5 12.5.1 12.5.2 15,19,24 13 12.5.3 19,24-25 12.5.4 12.5.4.1 13,24-25 24-25 See also Interpreting results presentation See notes 12.5.4.2 Not included 12.5.4.3 Not included 12.5.4.4 Not included 12.5.4.5 Not included 32 33 Changes since version 1.0 [October 2012] Slide 13 – removed note about formula to calculate NNT from RD, as this is not always the best approach. Slide 14 - Corrected alignment of risk ratio formulae. Slide 15 – added note regarding the use of the term ‘relative risk reduction’. Slide 19 – added absolute risk reduction expressed as numbers out of 100, and amended notes accordingly. Slide 24 – noted that NNT can also be calculated from relative effect measures. Slide 25 - Corrected value in last paragraph of notes – underlying risk of 5% - RD 11% = -6% (not -5%). Added note that multiple absolute risk figures could be calculated for different levels of assumed underlying risk. Noted that it may be more appropriate to calculate NNT from a relative effect measure. Suggestions for future development: Data collection exercise: 1. Incorporate Negri paper 2. Incorporate withdrawals/missing data 3. Update text to include more variation.

