Bioinfo/Stat545/Biostat646 Lab Notes
advertisement
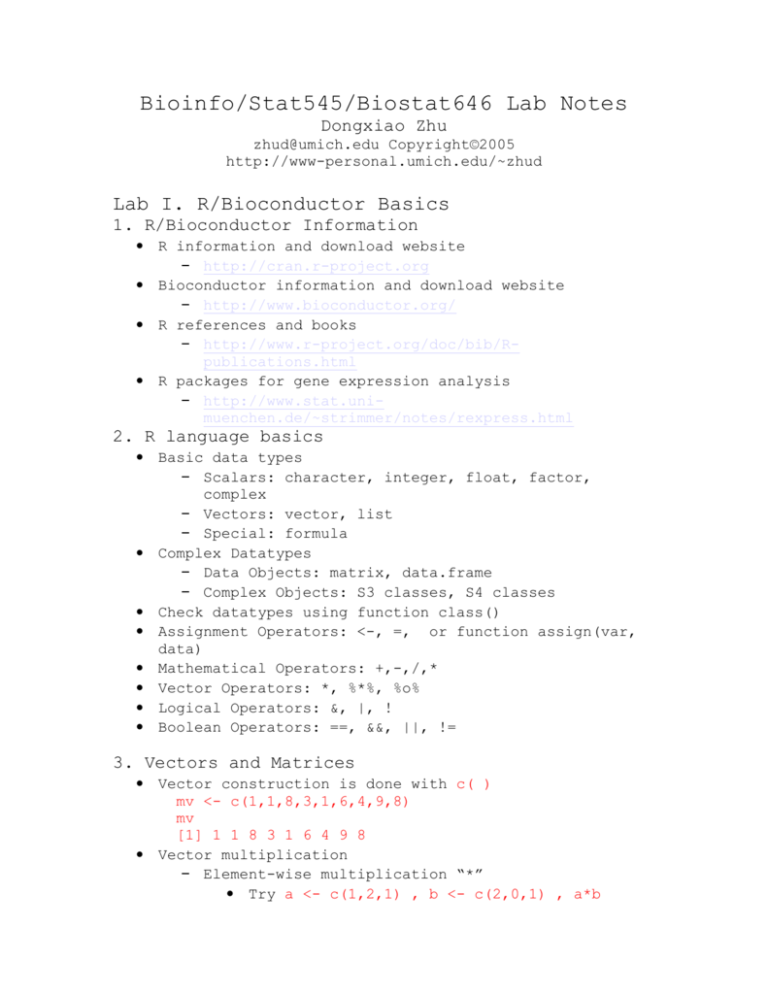
Bioinfo/Stat545/Biostat646 Lab Notes Dongxiao Zhu zhud@umich.edu Copyright©2005 http://www-personal.umich.edu/~zhud Lab I. R/Bioconductor Basics 1. R/Bioconductor Information • R information and download website – http://cran.r-project.org • Bioconductor information and download website – http://www.bioconductor.org/ • R references and books – http://www.r-project.org/doc/bib/Rpublications.html • R packages for gene expression analysis – http://www.stat.unimuenchen.de/~strimmer/notes/rexpress.html 2. R language basics • Basic data types – Scalars: character, integer, float, factor, complex – Vectors: vector, list – Special: formula • Complex Datatypes – Data Objects: matrix, data.frame – Complex Objects: S3 classes, S4 classes • Check datatypes using function class() • Assignment Operators: <-, =, or function assign(var, data) • Mathematical Operators: +,-,/,* • Vector Operators: *, %*%, %o% • Logical Operators: &, |, ! • Boolean Operators: ==, &&, ||, != 3. Vectors and Matrices • Vector construction is done with c( ) mv <- c(1,1,8,3,1,6,4,9,8) mv [1] 1 1 8 3 1 6 4 9 8 • Vector multiplication – Element-wise multiplication “*” • Try a <- c(1,2,1) , b <- c(2,0,1) , a*b – Inner product “%*%” and outer product “%o%” • Try a%*%b and a%o%b, what’s the difference? • Useful functions for vector arithmetic ab <- c(1:9) #initialize a vector mean(ab) #5 length(ab) #9 compare “sum(ab)” and “sum(ab>1)” #45, 8 compare “var(ab)” and “sd(ab)” #7.5, 2.738613 which(ab > 8) #9 any(ab>1) #T all(ab>1) #F • Matrix de novo construction C <- matrix(NA, 3, 4) • Matrix construction from several vectors with cbind( ), or rbind() mm <- cbind(c(1,1,8), c(3,1,6), c(4,9,8), c(2,1,3)) mm [,1] [,2] [,3] [,4] [1,] 1 3 4 2 [2,] 1 1 9 1 [3,] 8 6 8 3 • Matrix construction from one vector with array() or with matrix() array(mv, dim = c(3,3)) matrix(1:12, nrow=3, byrow=T) 4. Matrix Computation • Matrix multiplication – If not square matrices, transpose is needed. • t(mm) Matrix Transpose • mm%*%mm • Matrix decomposition – chol() #check spd simultaneously, square matrix – svd() #singular value decomposition, rectangular matrix – schur() #schur decomposition, square matrix 5. Factors and Lists • Categorical variables are specified as factor in R. For the character variable, R treats as factor automatically. For numeric value, you have to let R know. pain <- c(0,3,2,2,1) fpain <- factor(pain, levels = 0:3) levels(fpain) <- c(“none”, “mild”, “medium”, “severe”) fpain #factor object as.numeric(fpain) levels(fpain) • List is a combination of objects in R Use “$” to access objects in a list Use function list() and unlist(), see below. 6. R functions • R package contains a list of related functions • All functions return something, usually the result of the last statement in the function • Pass-by-value paradigm • A very simple function that returns single object power <- function(x,y) x^y #the single object returned power(2,3) #call function • If more than one object is return, use list() xy <- function(x,y) list(o1 =x^y, o2=x+y, o3=x*y, o4=x-y) #four objects are returned Os <- xy(2,3) names(Os) #see the contents of the list Os$o2 #access each object 7. Basic I/O • R manual file import/export manual • Import from delimited table – Function “read.table()” or “read.delim()” or “scan” or “read.csv”, “read.csv2” or “read.delim2”. – “read.delim()” is often more useful for massy dataset • Import from Software/DBMS • Import from internet • File export – Function “write.table()” 8. An I/O example • Download “gal.tsv” from – http://www-personal.umich.edu/~zhud/teach.htm • Use the following command to input data and output data. gal <- read.table(“gal.tsv”, h = T, row.names = 1) class(gal) dim(gal) write.table(gal, sep = “\t”, file = “galout.tsv”) 9. Data visualization #boxplot to check data distributions boxplot(gal, xlab = “different experimental conditions”, ylab = "log2 ratio of cy3/cy5 intensities", main = “galactose gene expression data”) #plot one gene expression profile(s) plot(as.numeric(gal[1,]), type = "l", col = 2, lwd = 2, lty = 1, xlab = "different experimental conditions", ylab = "log2 ratio of cy3/cy5 intensities", main = "GAL7 gene expression profile") #plot many gene expression profiles plot(as.numeric(gal[1,]), type = "n", col = 2, lwd = 2, lty = 1, xlab = "different experimental conditions", ylab = "log2 ratio of cy3/cy5 intensities", main = "All gene expression profile") for(i in 1:nrow(gal)) points(as.numeric(gal[i,]), type = “l”, col = i, lwd = 2, lty = i) 10. Indexing and conditional selection • Can be applied to both matrix and data.frame objects gal1<- gal[1:10,] #extract first ten rows gal2<- gal[,11:20]#extract right half matrix • Conditional selection idx1 <- apply(gal, 1, sd) gal3 <- gal[idx1 > 0.1,] #extract only specific rows #the code remove some values in a matrix using a “filter” idx2 <- apply(gal, c(1,2), function(x) (abs(x)>0.5)) idx2*t(gal) #a more complex example, find genes that are only on in one #condition/time point idx3 <- apply(gal, 1, function(x) abs((max(x[-which(x == max(x))]) - x[which(x == max(x))])) > 0.5) 11. Sort/Order and Missing Value • sort() and order() #only sort the first column, other columns does not change sort(as.numeric(gal[1,])) #the code below sort genes according to its fold change fc <- apply(gal, 1, function(x) max(abs(x))/min(abs(x))) ggal <- cbind(gal, fc) gggal <- ggal[order(ggal[,21]), decreasing = T] • Missing value is represented as NA – Initialize matrix with NA – good habit – NA op anything = = NA – NA related functions: is.na(), na.omit() – NA imputation methods, such as k-nearest neighbor, maximum liklihood. 12. Bioconductor • Bioconductor tutorial – http://www.bioconductor.org/workshop.html • Bioconductor packages – Preprocessing for Affymetrix data • affy, vsn. – Preprocessing for cDNA data • marrayClasses, marrayInput, marrayNorm,, marrayPlots, vsn, sma – Differential expression • edd, genefilter, multtest, ROC – Clustering and classification. e1071 – Network inference. GeneTS, GeneNT 13. How to use? • Short courses • Vignettes – Problem-oriented “How-To”s • R demos – e.g. demo(marrayPlots) • R help system – interactive with browser or printable manuals; – detailed description of functions and examples; – e.g. help(maNorm), ? marrayLayout. • Search Mailing list archives; Google • Post to mailing list • All on WWW References: William N. Venables and Brian D. Ripley. Modern Applied Statistics with S. Fourth Edition. Springer, 2002. ISBN 0-387-95457-0 William N. Venables and Brian D. Ripley. S Programming. Springer, 2000. ISBN 0-387-98966-8. Peter Dalgaard. Introductory Statistics with R. Springer, 2002. ISBN 0387-95475-9.
