Test #1 Notes: Characteristics of Life, Biology - Parkway C-2
advertisement
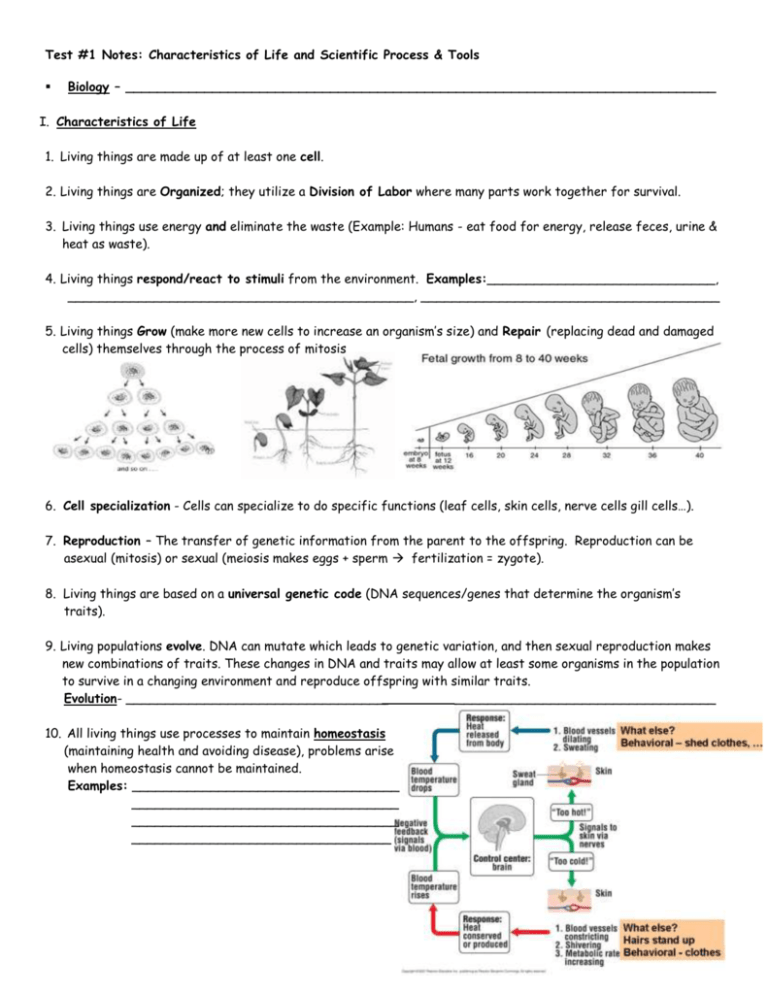
Test #1 Notes: Characteristics of Life and Scientific Process & Tools Biology – ___________________________________________________________________________ I. Characteristics of Life 1. Living things are made up of at least one cell. 2. Living things are Organized; they utilize a Division of Labor where many parts work together for survival. 3. Living things use energy and eliminate the waste (Example: Humans - eat food for energy, release feces, urine & heat as waste). 4. Living things respond/react to stimuli from the environment. Examples:_____________________________, ____________________________________________, ______________________________________ 5. Living things Grow (make more new cells to increase an organism’s size) and Repair (replacing dead and damaged cells) themselves through the process of mitosis 6. Cell specialization - Cells can specialize to do specific functions (leaf cells, skin cells, nerve cells gill cells…). 7. Reproduction – The transfer of genetic information from the parent to the offspring. Reproduction can be asexual (mitosis) or sexual (meiosis makes eggs + sperm fertilization = zygote). 8. Living things are based on a universal genetic code (DNA sequences/genes that determine the organism’s traits). 9. Living populations evolve. DNA can mutate which leads to genetic variation, and then sexual reproduction makes new combinations of traits. These changes in DNA and traits may allow at least some organisms in the population to survive in a changing environment and reproduce offspring with similar traits. Evolution- ___________________________________________________________________________ 10. All living things use processes to maintain homeostasis (maintaining health and avoiding disease), problems arise when homeostasis cannot be maintained. Examples: __________________________________ __________________________________ __________________________________ _________________________________ Page 1 II. Biology Themes 1. Levels of Organization – A series of increasingly complex combinations of atoms - the smallest unit of matter, dead or alive. Atoms Molecules (micro = _______, macro = ________) Organelles – cell structures that perform specific functions Cells – groups of organelles all working towards common functions Tissues – groups of cells all working towards common functions Organs – groups of tissues Systems – groups of organs Organism - an individual that can carry out all life processes Population/ Species - successfully interbreeding organisms Community – ALL organisms in a given area Ecosystem – living and nonliving in an area Biome – large ecosystems Biosphere – where life exists (Earth) 2. Law of Conservation of Mass and Energy – Under normal conditions mass and energy cannot be created or destroyed, only converted from one form to another. Mass – The amount of matter an object possesses, numbers and units are used to measure the amount of mass (Quantity) EXAMPLES: 2 oxygen atoms, 2 liters of pepsi, 4 cups of sugar, 150 lbs. of human Energy – The ability to change or move mass - EXAMPLES: __________, ___________, ___________, ___________, ___________ The ultimate source of energy for life on the earth is – _____________ These organisms have the ability to convert radiant energy into chemical energy - ______________ , ______________ These organisms use the chemical energy for everyday life functions - ___________________ , __________________ Photosynthesis – The conversion of radiant energy from the sun to chemical energy (sugar) usable by organisms. REACTANTS 6CO2 + (carbon dioxide) 6H2O (Water) PRODUCTS + Light (Energy) C6H12O6 (Glucose) + 6O2 (oxygen) Product – element or compound produced by a chemical reaction Reactant – element or compound that enters into a chemical reaction Page 2 Cellular Respiration – The use of chemical energy by a cell to perform functions that allows the cell and the organism to live. C6 H12 O6 (Glucose) + 6O2 6H2O (Oxygen) (Water) + 6CO2 + (Carbon Dioxide) Energy (Heat and/or ATP) Count the number of Carbons, Hydrogens, and Oxygens of the products and compare to the number of each in the reactants. PRODUCTS (TOTAL) C = _____, H = ______, O = ______ REACTANTS (TOTAL) C = _____, H = ______, O = ______ How does this apply to the Law of Conservation of Mass? NOTE: Though only autotrophs can convert radiant energy + water + carbon dioxide into chemical energy or glucose, ALL organisms utilize cellular respiration for life. 3. Homeostasis – Maintaining normal cellular conditions or internal environment. Examples: Water balance, Salt balance, Sugar balance, Temperature, pH Levels, etc… Feedback Mechanisms function to maintain homeostasis A. Negative Feedback Loop – The action of the mechanism keeps reversing itself w/o becoming too high, or too low. Examples: _____________________________ B. Positive Feedback Loop – The action does not reverse, but instead becomes more intense until the action is over. Examples: ________________________________ Page 3 4. Size, Structure, & Function – The size and structure/ shape of an object will determine its function. Object SHAPE FUNCTION Duck’s Foot Horse’s Foot Lizard’s Foot Object SIZE (in comparison to body) FUNCTION Seagull Wing Ostrich Wing III. Scientific Process/Method, Tools, and Skills Scientific Processes – The use of scientific tools and common sense to solve a problem. Steps and Skills of the Scientific Process 1. Observe situation, identify, and state the problem Example: You collected seeds from a favorite outdoor plant at the end of the summer, stored them indoors for the winter, and then planted them outdoors the following spring. None of the stored seeds developed into plants, but seeds from the plant that were not picked up and were left outside germinated in the normal way. State the problem: ___________________________________________________________________ 2. Gather information – Someone else probably has already found the solution to your problem. Where can you go to find information - __________________________________________________ 3. Form a Hypothesis – A possible solution to your problem, can be tested via an experiment. State a Hypothesis from the problem - ____________________________________________________ ____________________________________________________ (Hypotheses usually come in the If…then format. Ex. If I poke the balloon with a knife, then it will pop.) Why is a hypothesis also called an educated guess? - ________________________________________ _______________________________________________________________________________ 4. Write and conduct an experimental procedure – The experiment is testing a hypothesis in a controlled environment. The test must be applied to two groups that are homogenous (the same) except for one factor, called the independent variable. Independent (Manipulated) Variable – The one variable, deliberately changed by the experimenter that influences the results of an experiment. Often this is derived from what immediately follows the “IF” in the prediction. Page 4 Dependent (Responding) Variable - The variable that is observed and changes in response to the manipulated variable. Often this is derived from what immediately follows the “THEN” in the prediction. In an experiment there are two groups: Control Group – This is the standard, nothing should be changed. There is no manipulated variable. No observable changes should occur. Experimental Group – One variable is manipulated, which may result in an observable change. ? Why must the control and experimental groups be homogenous (the same) with exception to the one manipulated variable? When the control and experimental groups are the same, with the exception of the one manipulated variable, this is called a controlled experiment. Controlled experiments should be repeated many times to ensure that data is valid. Experimental procedures are written instructions for setting up an experiment. The directions should be easy enough to understand so that someone else could use them to complete the experiment. Directions should include: At least 3 steps giving “easy to understand” directions State the changes in the independent variable (with units) State how to measure the effect on the dependent variable (with units). What data will be collected? State the factors that need to be kept constant (with units) Example Procedure: 1. Fill 10 different test tubes with 10 mL of water at 70 F, and add the same amount and kind of algae to each tube. 2. Place 2 test tubes each under different light bulbs: 50 watts, 100 watts, 200 watts, 300 watts, and 400 watts. 3. Count the number of bubbles (released oxygen from photosynthesis) produced in each test tube for one minute. After reading the above example, do the following: (a) underline the independent variable with red (b) underline the dependent variable with blue (c) underline the constants with yellow 5. Collect, Record, Organize, and Analyze Data from the Experiment A. Data – Information gathered from the experiment Quantitative - _________________________ Qualitative -_____________________ ? Why are standards of measurement (SI/ metric units) important? *Examples of units - _________________________________________________________ Tools for collecting data: Page 5 1) Microscopy (The Microscope) Properties of Light Microscopes: Magnification – An increase in the size of an image. Resolving/Resolution Power – How clear the magnified specimen appears. Field of View – How much of the image is seen through ocular. 40x = 100x = 400x = Depth of View – How resolute/clear images appear at different distances from the ocular/eyepiece. Increasing the magnification will decrease resolving power, field of view, and depth of view. Data Table Contrasting Light vs. Electron Microscopes Microscope Characteristics Light Microscope Electron Microscope Highest practical magnification Radiation source & medium of travel Light – Air Electron beam – Vacuum Colored specimens, stain’s & dye’s No light = no color Radiation focusing mechanism Specimen image Specimen type (dead or alive) Size & Cost Structures and Functions of a Common Light Microscope Color each microscope part by its color as indicated in the data table, below left. the word in the data table and on the picture of the light microscope, below right. Microscope Part 1. Ocular/Eyepiece (red) 2. Ocular Tube (light green) 3. Arm & 6.Base (light blue, dark blue) 4.Course and 5.Fine Objective Knobs (dark & light brown) 7. Revolving Nosepiece (pink) 8. Objective Lens Microscope Part Function Holds a 10x lens for magnification and where the specimen is viewed Creates a distance between ocular lens and objective lens for correct magnification The 2 parts held while carrying a scope Moves the stage up and down to focus or improve resolution of the image Moves objectives w/different magnifying powers to be rotated above specimen Carries the 2nd lens for magnification (4, 10, 40, & 100x) (dark green) 10. Stage w/9.(clip) (black) 6. Slide Adjustment 11. Iris Diaphragm (orange) 12. Light Source (yellow) 13. Light Intensity Knob (gray) Holds slide/specimen in place for viewing Moves slide/specimen (forward, left, right, backword) w/o you touching the slide Controls light passing through specimen Provides light needed to produce an image Regulates light intensity from the source Be sure to color in 2) Scientific Sampling – Using a small portion of the total count to represent the entire count. Examples: ___________________________________ _______________________________ 3) Models – An enlarged (cell) or reduced (globe) replica of an object to make observations and communication about objects easier B. Displaying Data Graphs – A visual representation of data showing relationships between variables. They include pie, bar, and line graphs. a) You can put a great deal of data into a small amount of space. 6 b) Being able to see the data 13 makes it easier to understand. Page 6 2) Scientific Sampling – Using a small portion of the total count to represent the entire count. Examples: __________________________________________________________________ 3) Models – An enlarged (cell) or reduced (globe) replica of an object to make observations and communication about objects easier 4) Graphs A visual representation of data showing relationships between variables. They include pie, bar, and line graphs. You can put a great deal of data into a small amount of space. Being able to see the data makes it easier to understand. Line graphs can be used to make predictions of values that have not been measured. Interpolation – __________________________________________________________________ Extrapolation– __________________________________________________________________ Making a Line Graph from the Results Put information into a data table before graphing. This should save time and reduce mistakes Use graph paper or a computer program to construct a graph. Try not to use notebook paper. 1. Determine which variables will be graphed on which axis (line). a. X-axis/ Horizontal axis/ Independent axis – Will hold different values of the manipulated variable. The variable on this axis drives the results on the Y axis. (Time in Weeks that 100 Seeds were kept at 0 degrees Celsius) b. Y-axis/Vertical axis/Dependent axis – Holds the responding variable that the independent variable or experimenter can affect. It includes the results on the responding variable (Percentage of Seeds that germinated) 2. 3. Label each axis and their units: X-axis = Time (weeks) Y-axis = Seeds germinated (percentage). Determine the scale of each axis, separately. Scale is the value given to each grid of the graph along each axis. ***How to determine the scale of each axis*** Determine the scale of each axis, separately. Scale is the value given to each grid of the graph along each axis. Use as much of the graph as possible on each axis. a) Determine the range of each axis by subtracting the lowest data value (or zero) from the highest data value __________ - __________ = __________ Highest Lowest RANGE b) Count the number of grids/lines on each axis. ___________ # of grids Page 7 c) Divide the range of data values by the number of grids on each axis. ________÷_________ =________ RANGE # of Grids Interval Let “zero” be the origin for both axis unless the data makes it unrealistic Maintain the same interval throughout an axis. Usually the X (5, 10, 15) and Y (2, 4, 6) axis will have different intervals. 4. Plot the data points from the data table and draw a continuous line (straight OR curved) that best represents the data trends. Your line will not necessarily touch all the data points in a connect-the-dots fashion. When there are two sets of data, both can be plotted on the same graph, distinguishing between the two with either a different color or different style of best-fit line. Make a key or legend to identify each set of data. 5. Give the graph a title that states the relationship between the independent and dependent variables (or states what is being tested). Example: The Effect of Water on Plant Growth DATA TABLE Time (weeks) 2 4 6 8 10 12 14 16 Seed Germ.(%) 20 29 42 52 66 63 60 53 Interpolate – 7 weeks = ________% Extrapolate – 21 weeks = _______% 6. Form a Conclusion – Does the experiment support or not support/ reject the hypothesis? In science, nothing can be absolutely proven true or false, it can only be supported or not supported. Page 8 A conclusion includes: discussion of the data, and whether or not the data support the hypothesis the potential sources of error suggests new potential investigations of the problem. How can a wrong hypothesis be a good thing - _____________________________________, ____________________________________, ___________________________________ 7. Communication – the sharing of information, often through publication in journals. Why is communication important to the field of science – _____________________________ _______________________________________________________________________ Repeat the test Experimental systems exhibit variation. All measurements suffer from variation (how tall are you in nanometers?). The purpose of repeating an experiment is to account for variation and provide a degree of certainty. If you see something only once, how do you know if it is reproducible or believable? Repeating the experiment allows you to assess the variability, and state some degree of confidence in an observation. What is a Scientific Theory? 1. A unifying explanation for a broad range of observations. 2. A collection of related hypothesis that has been ____________________________________ ________________________________________________________________________ 3. Time tested concepts that make useful predictions. * A theory is not a guess; it is a proposed solution to a problem backed by repeatable experimental data. Page 9 Example Experiment Students were investigating the effect of antibiotic A to kill the bacteria Staphylococcus aureus. To determine the strength of antibiotic A that would kill the bacteria the most they measured the zone of inhibition that resulted. The results of the experiment are shown in the data table below. What is the testable question or problem that is the basis for this investigation? Write an appropriate hypothesis for this investigation. Identify the independent variable in this investigation. Concentration of Antibiotic A (mg/ml) Zone of Inhibition (mm) .05 6 .10 7 .15 8 .20 14 .25 16 .30 16 .35 16 Indentify the dependent variable in this investigation. Indentify two variables, other than the one investigated, that could have an effect on the zone of inhibition. 1. 2. Why is it important to hold some conditions constant during an investigation? Identify two factors that should be held constant for this investigation. 1. 2. Identify three pieces of laboratory equipment necessary to conduct this investigation. 1. 2. 3. Use the data from Data Table 1 to construct a line graph on the grid below. Be sure to provide: - an appropriate title correctly plotted data labeled axes with units appropriate number scales Page 10 Describe a procedure that has at least three steps that a student will need to follow to conduct this investigation. Be specific, it must be written so someone else can follow your instructions and successfully complete the investigation. Remember you have done this experiment. 1. 2. 3. 4. 5. Biology Review Sheet Test #1: Characteristics of Life, Biology Themes, & Scientific Processes Questions 1-22: Multiple Choice Know the characteristics of living organisms (p. 1) Know the levels of organization of living organisms (p. 2) Know the idea of the Law of Conservation of mass and energy (p. 3) Homeostasis – o define and identify examples (p. 2) o distinguish positive v. negative feedback mechanisms (p. 2) Know what structure determines (p. 4) Compare photosynthesis and respiration (p. 3-4) o Know terms and examples of organisms that can do photosynthesis and those that cannot (p. 3) o Products and reactants (p.4) Know the steps of the scientific process (p. 4-6) Distinguish between independent variable and dependent variable (p. 4-9) Distinguish between qualitative data and quantitative data and identify examples(p. 5) Microscope- Parts and characteristics of microscope (p. 6-7) Know what scientific sampling means and be able to identify examples of it (p. 7) Identify reasons for o Controlling conditions in an experiment (p. 5) o repeating experiments (p. 9) o identify reasonable conclusions. (p. 9) o identify changes that would improve the experimental design. (p. 9) o sharing results (p. 9) Distinguish between a hypothesis and a theory (p. 2 & 6) Constructed Response – Provided a scenario for an experiment: o Identify dependent variable and independent variable o Identify factors that should be kept constant (controls/constants) o Graph data provided in a table. Be sure to include title, labels and units for each axis, equal intervals for each axis, and a line of best fit for the data o Describe the relationship between the variables in the data provided o Interpolate and/or extrapolate based on the data you graphed o Identify possible sources of error in the experiment. Design a new experiment related to the one described o Write a hypothesis o Write at procedure for the new experiment o Construct a data table for collecting data (proper labels & units) Distinguish between a hypothesis and a theory (What makes them different?) Describe at least 5 characteristics that all living organisms share Page 11
