SCATTER DIAGRAM LEVEL 6
advertisement

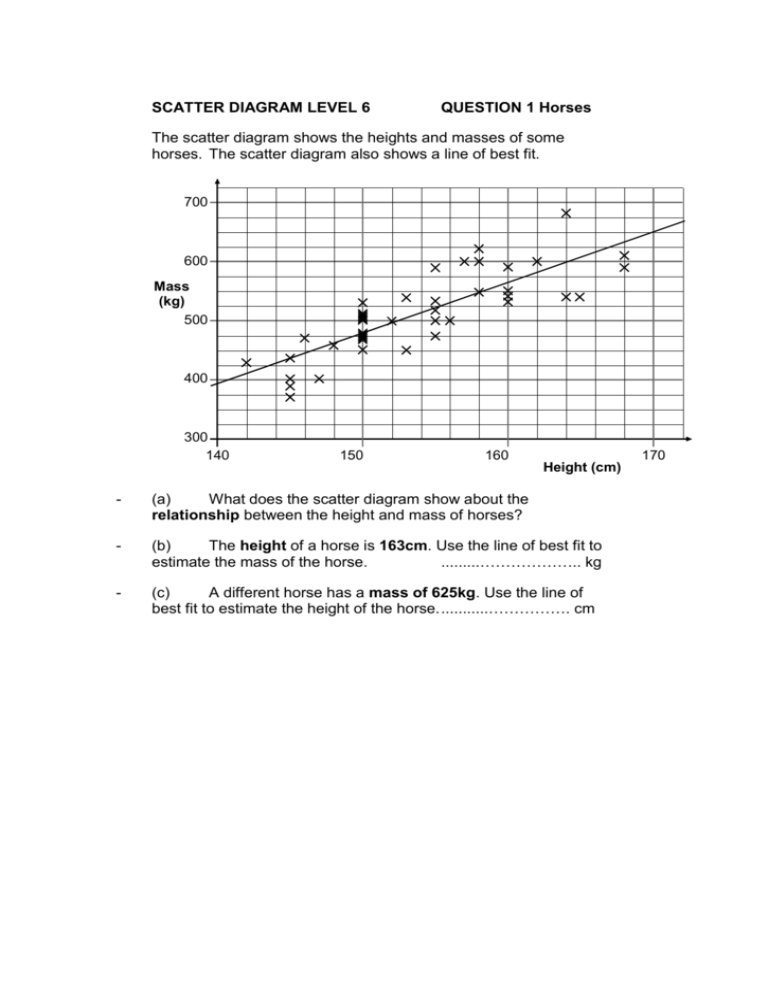
SCATTER DIAGRAM LEVEL 6 QUESTION 1 Horses The scatter diagram shows the heights and masses of some horses. The scatter diagram also shows a line of best fit. 700 600 Mass (kg) 500 400 300 140 150 160 Height (cm) - (a) What does the scatter diagram show about the relationship between the height and mass of horses? - (b) The height of a horse is 163cm. Use the line of best fit to estimate the mass of the horse. .........……………….. kg - (c) A different horse has a mass of 625kg. Use the line of best fit to estimate the height of the horse. ...........……………. cm 170 (d) A teacher asks his class to investigate this statement: "The length of the back leg of a horse is always less than the length of the front leg of a horse." What might a scatter graph look like if the statement is correct? Use the axes below to show your answer. 110 100 Length of back leg 90 (cm) 80 70 70 80 90 100 110 Length of front leg (cm) QUESTION 2 Pizza A company has 10 pizza shops. All the shops sell the same types of pizza at the same prices. Mr. Bal asked: “Is there a relationship between the number of pizzas sold and the number of people who live within 3 miles of a shop?” Mrs. Evans asked: “Is there a relationship between the number of pizzas sold and the floor area of a shop?” They looked at these graphs. GRAPH 1 400 350 Average number of pizzas sold each day x 300 x x x 250 200 x x x x x 150 x 100 50 0 0 5 10 15 20 25 30 35 40 45 50 55 60 55 60 Number of people who live within 3 miles (thousands) GRAPH 2 400 350 Average number of pizzas sold each day x x 300 250 x x 200 x x 150 x x x 100 x 50 0 0 5 10 15 20 25 30 35 Floor area (m²) 40 45 50 -(a) What does graph 1 show about the relationship between the average number of pizzas sold each day and the number of people who live within 3 miles of a shop? (b) - What does graph 2 show about the relationship between the average number of pizzas sold each day and the floor area of a shop? QUESTION 3 Scores A competition has 3 different games. (a) Jeff plays 2 of the games. Game A Game B 62 53 Score Game C To win, Jeff needs a mean score of 60. How many points does he need to score in Game C? Show your working. (b) Imran and Nia play the 3 games. Their scores have the same mean. The range of Imran’s scores is twice the range of Nia’s scores. Fill the missing scores in the table below: Imran’s scores ............... 40 ............... 35 40 45 Nia’s scores The scatter diagrams show the scores of everyone who plays all 3 games. 100 100 xx 80 40 x 20 x xx x x x 80 x x x x x Game 60 B x x x x Game 60 C x xx 40 xx x x x 20 x x x x 0 0 20 40 60 Game A 80 100 0 0 20 40 60 Game A 80 100 (c) Look at the scatter diagrams. Which statement most closely describes the relationship between the games? Tick () the correct statement. Game A and Game B perfect negative relationship negative relationship no relationship positive relationship perfect positive relationship Game A and Game C perfect negative relationship (d) negative relationship no relationship positive relationship perfect positive relationship What can you tell about the relationship between the scores on Game B and the scores on Game C? Tick () the statement that most closely describes the relationship. Game B and Game C perfect negative relationship negative relationship no relationship positive relationship perfect positive relationship


