Appendix A
advertisement

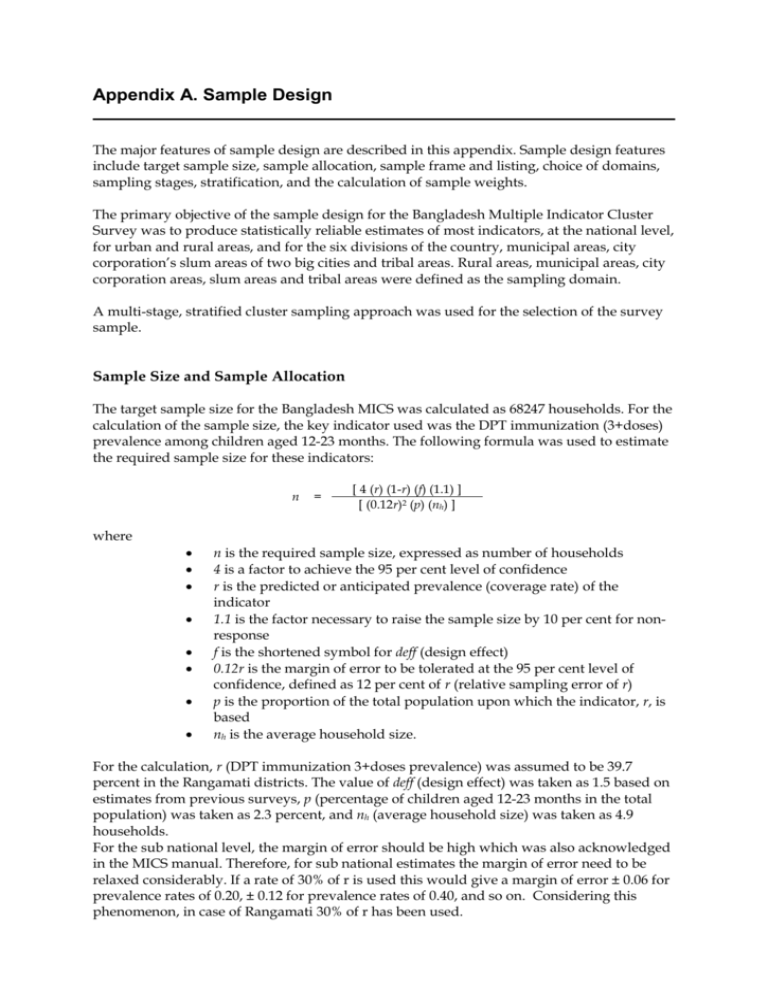
Appendix A. Sample Design The major features of sample design are described in this appendix. Sample design features include target sample size, sample allocation, sample frame and listing, choice of domains, sampling stages, stratification, and the calculation of sample weights. The primary objective of the sample design for the Bangladesh Multiple Indicator Cluster Survey was to produce statistically reliable estimates of most indicators, at the national level, for urban and rural areas, and for the six divisions of the country, municipal areas, city corporation’s slum areas of two big cities and tribal areas. Rural areas, municipal areas, city corporation areas, slum areas and tribal areas were defined as the sampling domain. A multi-stage, stratified cluster sampling approach was used for the selection of the survey sample. Sample Size and Sample Allocation The target sample size for the Bangladesh MICS was calculated as 68247 households. For the calculation of the sample size, the key indicator used was the DPT immunization (3+doses) prevalence among children aged 12-23 months. The following formula was used to estimate the required sample size for these indicators: n = [ 4 (r) (1-r) (f) (1.1) ] [ (0.12r)2 (p) (nh) ] where n is the required sample size, expressed as number of households 4 is a factor to achieve the 95 per cent level of confidence r is the predicted or anticipated prevalence (coverage rate) of the indicator 1.1 is the factor necessary to raise the sample size by 10 per cent for nonresponse f is the shortened symbol for deff (design effect) 0.12r is the margin of error to be tolerated at the 95 per cent level of confidence, defined as 12 per cent of r (relative sampling error of r) p is the proportion of the total population upon which the indicator, r, is based nh is the average household size. For the calculation, r (DPT immunization 3+doses prevalence) was assumed to be 39.7 percent in the Rangamati districts. The value of deff (design effect) was taken as 1.5 based on estimates from previous surveys, p (percentage of children aged 12-23 months in the total population) was taken as 2.3 percent, and nh (average household size) was taken as 4.9 households. For the sub national level, the margin of error should be high which was also acknowledged in the MICS manual. Therefore, for sub national estimates the margin of error need to be relaxed considerably. If a rate of 30% of r is used this would give a margin of error ± 0.06 for prevalence rates of 0.20, ± 0.12 for prevalence rates of 0.40, and so on. Considering this phenomenon, in case of Rangamati 30% of r has been used. The resulting number of households from this exercise was about 900 households which is the sample size needed in each district – thus yielding about 68250 in total. The average cluster size in the Bangladesh MICS was determined as 35 households, based on a number of considerations, including the budget available, and the time that would be needed per team to complete one cluster. Dividing the total number of households by the number of households per cluster, it was calculated that the selection of a total number of 26 clusters would be needed in each district. Equal allocation of the total sample size to the 75 domains was targeted. Therefore, 26 clusters were allocated to each district with the final sample size calculated at 68250 households (1950 cluster X 35 households per cluster). In each stratum, the clusters (primary sampling units) were distributed to rural, municipal, city corporations, slum and tribal areas on PPS method. Table SD.1: Allocation of Sample Clusters (Primary Sampling Units) to Sampling Domains Divisions Total Households (2006 estimates) City Municip corporati Rural al on slum Tribal Number of clusters City Munic corpor Total Rural ipal ation slum Tribal 182 120 36 26 0 0 Barisal 1801760 1530194 212977 58589 Chittagong 5064450 3599056 736372 519086 55068 154868 364 220 66 26 26 26 Dhaka 9377142 5974964 1865375 1350313 152046 34444 520 340 102 26 26 26 Khulna 3410039 2700135 514931 194973 286 200 60 26 0 0 Rajshahi 7516545 6299046 1038454 91878 87167 468 320 96 26 0 26 Sylhet 1547025 1339048 72526 130 80 24 26 0 0 21442443 4503560 2287365 207114 276479 1950 1280 384 156 52 78 Total 28716961 135451 Sampling Frame and Selection of Clusters The 2001 census frame was used for the selection of clusters. Census enumeration areas were defined as primary sampling units (PSUs), and were selected from each of the sampling domains by using systematic pps (probability proportional to size) sampling procedures, based on the estimated sizes of the enumeration areas from the 2001 Population Census. The first stage of sampling was thus completed by selecting the required number of enumeration areas from each of the 5 strata namely rural, municipal, city corporations, slum and tribal areas. Listing Activities Since the sample frame of the 2001 Population Census was not up to date, household lists in all selected enumeration areas were updated prior to the selection of households. For this purpose, listing teams were formed, who visited each enumeration area, and listed the occupied households. The BBS officials working in the upazila were responsible for the listing of all households in the respective PSUs. Selection of Households Lists of households were prepared by the Upazila officials of BBS. The households were sequentially numbered from 1 to 100 (or more) households in each enumeration area at the where selection of 35 households in each enumeration area was carried out using systematic selection procedures. Calculation of Sample Weights The Bangladesh Multiple Indicator Cluster Survey sample is not self-weighted. Essentially, by allocating equal numbers of households to each of the regions, different sampling fractions were used in each stratum/district since the size of the stratum/district varied. For this reason, sample weights were calculated and these were used in the subsequent analyses of the survey data. The major component of the weight is the reciprocal of the sampling fraction employed in selecting the number of sample households in that particular sampling domain: Wh = 1 / fh The term fh, the sampling fraction at the h-th stratum, is the product of probabilities of selection at every stage in each sampling domain: fh = P1h * P2h * P3h where Pih is the probability of selection of the sampling unit in the i-th stage for the h-th sampling domain. Since the estimated numbers of households per enumeration area prior to the first stage selection (selection of primary sampling units) and the updated number of households per enumeration area were different, individual sampling fractions for households in each enumeration area (cluster) were calculated. The sampling fractions for households in each enumeration area (cluster) therefore included the probability of selection of the enumeration area in that particular sampling domain and the probability of selection of a household in the sample enumeration area (cluster). A second component which has to be taken into account in the calculation of sample weights is the level of non-response for the household and individual interviews. The adjustment for household non-response is equal to the inverse value of: RR = Number of interviewed households / Number of occupied households listed After the completion of fieldwork, response rates were calculated for each sampling domain. These were used to adjust the sample weights calculated for each cluster. Response rates in the Bangladesh Multiple Indicator Cluster Survey are shown in Table HH.1 in this report. Similarly, the adjustment for non-response at the individual level (women and under-5 children) is equal to the inverse value of: RR = Completed women’s (or under-5’s) questionnaires / Eligible women (or under-5s) Numbers of eligible women and under-5 children were obtained from the household listing in the Household Questionnaire in households where interviews were completed. The unadjusted weights for the households were calculated by multiplying the above factors for each enumeration area. These weights were then standardized (or normalized), one purpose of which is to make the sum of the interviewed sample units equal the total sample size at the national level. Normalization is performed by multiplying the aforementioned unadjusted weights by the ratio of the number of completed households to the total unadjusted weighted number of households. A similar standardization procedure was followed in obtaining standardized weights for the women’s and under-5’s questionnaires. Adjusted (normalized) weights varied between 0.08246123 and 3.86677381 in the 1950 enumeration areas (clusters). Table showing weight for households, women and under five children. Domains Barisal City corporation Chittagong City corporation Dhaka City corporation Khulna City corporation Rajshahi City corporation Sylhet City corporation Chittagong slum Dhaka slum Chittagong tribal Dhaka tribal Rajshahi tribal Bagerhat Bandarban Barguna Barisal Bhola Bogra Brahmanbaria Chandpur Chittagong Chuadanga Comilla Cox's bazar Dhaka Dinajpur Faridpur Feni Gaibandha Gazipur Gopalganj Habiganj Jamalpur Jessore Jhalokati Jhenaidah Joypurhat Khagrachhari Khulna hhweight wmweight chweight 0.14606381 0.13499979 0.13548449 1.34717999 1.32378227 1.31590564 3.72653499 3.86677381 3.82872500 0.50893294 0.48158533 0.49214192 0.19294892 0.18652500 0.18959551 0.23922696 0.23966790 0.23540858 0.14269952 0.13678468 0.13833890 0.41601905 0.45890848 0.42373755 0.41605770 0.42692081 0.42324852 0.08765132 0.08637878 0.08246123 0.22574216 0.23102891 0.21846255 0.88920415 0.89489500 0.88803317 0.18122762 0.19363118 0.18804135 0.64995734 0.63676165 0.64277370 1.20060368 1.24631673 1.24032364 0.96365048 0.98587957 0.98872114 1.91181672 1.96872794 1.90816362 1.21035691 1.23428011 1.25880689 1.22361283 1.27705675 1.23384961 2.17867012 2.16669202 2.19553353 0.62476538 0.60055652 0.61372876 2.32075987 2.26712588 2.32411522 0.82226899 0.81960128 0.80298094 1.67464263 1.68451589 1.74101555 1.60282236 1.56151414 1.58355447 0.97236197 0.97649871 0.96580910 0.59050752 0.56778566 0.59004624 1.39177301 1.33022325 1.33941761 1.37671072 1.37971125 1.37342187 0.62195213 0.63169297 0.60566294 0.88735960 0.90211634 0.89343011 1.40189285 1.45222908 1.38968521 1.44624543 1.40105177 1.44163619 0.40943967 0.40092793 0.41676901 0.94528538 0.92117781 0.91900768 0.55632039 0.53821897 0.54549885 0.30517854 0.30617819 0.29448321 0.88389612 0.87682353 0.85438631 Domains Kishorgonj Kurigram Kushtia Lakshmipur Lalmonirhat Madaripur Magura Manikganj Maulvibazar Meherpur Munshiganj Mymensingh Naogaon Narail Narayanganj Narsingdi Natore Nawabganj Netrakona Nilphamari Noakhali Pabna Panchagarh Patuakhali Pirojpur Rajbari Rajshahi Rangamati Rangpur Satkhira Shariatpur Sherpur Sirajganj Sunamganj Sylhet Tangail Thakurgaon hhweight wmweight chweight 1.48135672 1.48319082 1.45368299 1.12521635 1.14710840 1.15162408 1.05503621 1.08503181 1.08271290 0.85665921 0.88459310 0.89277175 0.72020717 0.71101009 0.71867198 0.67603637 0.68727448 0.67937553 0.47005687 0.47470616 0.45860631 0.83184542 0.83685701 0.86481484 0.85436154 0.87763203 0.85395497 0.39631016 0.39007365 0.39569375 0.72192434 0.67607044 0.69848271 2.85021865 2.78224336 2.79889435 1.61592466 1.60024754 1.65333317 0.41933697 0.40643557 0.40177600 1.40419826 1.41981681 1.37486955 1.14553115 1.12397341 1.11398800 1.00851741 1.01211166 0.98143582 0.80863499 0.80205040 0.82279546 1.19202321 1.16613119 1.18391095 0.98188406 0.95278956 0.96558333 1.31860150 1.31229647 1.34277378 1.36288904 1.38071896 1.39438484 0.52621225 0.51571842 0.50882763 0.83630700 0.88674954 0.83903120 0.53061317 0.53907907 0.51867501 0.55626854 0.54961866 0.54567834 1.26040792 1.22985163 1.21832787 0.30588833 0.29810356 0.30493770 1.69750600 1.64785977 1.62395670 1.17930296 1.19224624 1.17551992 0.62924377 0.61921535 0.63005131 0.90083194 0.88535083 0.89745165 1.73360978 1.74802832 1.70712683 1.01281386 1.01281833 1.02350000 1.03832755 1.06472983 1.06241528 2.16779644 2.13886787 2.14993377 0.74706099 0.68905929 0.71526834 Sample weights were appended to all data sets and analyses were performed by weighting each household, woman or under-5 with these sample weights.


