heating curve lab
advertisement
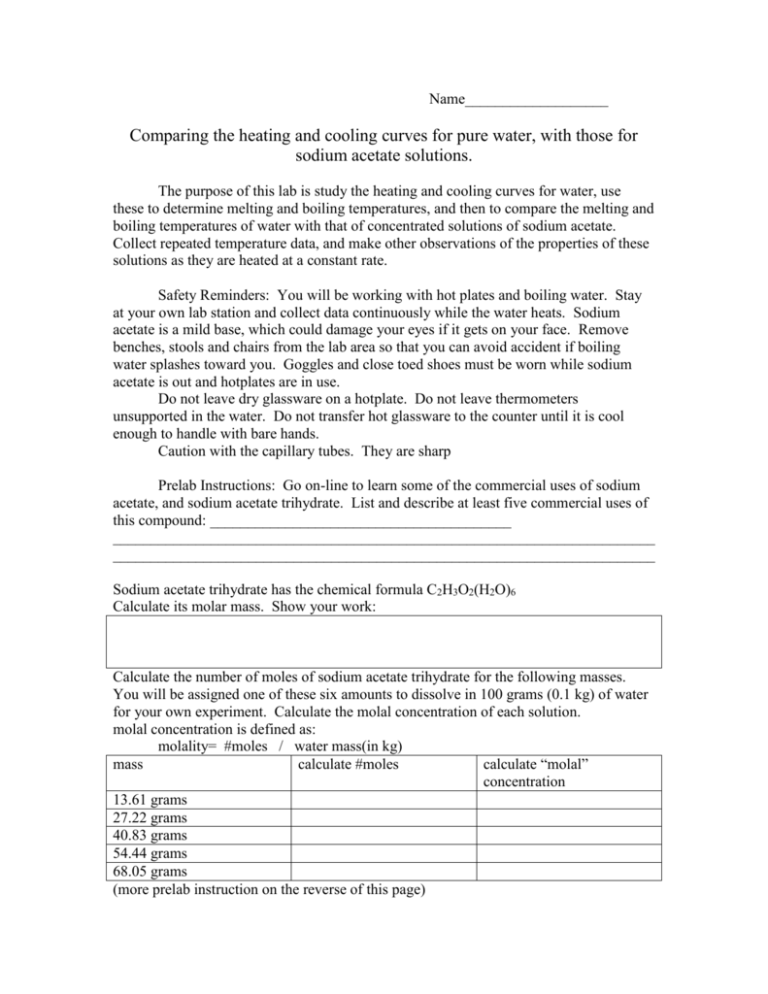
Name___________________ Comparing the heating and cooling curves for pure water, with those for sodium acetate solutions. The purpose of this lab is study the heating and cooling curves for water, use these to determine melting and boiling temperatures, and then to compare the melting and boiling temperatures of water with that of concentrated solutions of sodium acetate. Collect repeated temperature data, and make other observations of the properties of these solutions as they are heated at a constant rate. Safety Reminders: You will be working with hot plates and boiling water. Stay at your own lab station and collect data continuously while the water heats. Sodium acetate is a mild base, which could damage your eyes if it gets on your face. Remove benches, stools and chairs from the lab area so that you can avoid accident if boiling water splashes toward you. Goggles and close toed shoes must be worn while sodium acetate is out and hotplates are in use. Do not leave dry glassware on a hotplate. Do not leave thermometers unsupported in the water. Do not transfer hot glassware to the counter until it is cool enough to handle with bare hands. Caution with the capillary tubes. They are sharp Prelab Instructions: Go on-line to learn some of the commercial uses of sodium acetate, and sodium acetate trihydrate. List and describe at least five commercial uses of this compound: ________________________________________ ________________________________________________________________________ ________________________________________________________________________ Sodium acetate trihydrate has the chemical formula C2H3O2(H2O)6 Calculate its molar mass. Show your work: Calculate the number of moles of sodium acetate trihydrate for the following masses. You will be assigned one of these six amounts to dissolve in 100 grams (0.1 kg) of water for your own experiment. Calculate the molal concentration of each solution. molal concentration is defined as: molality= #moles / water mass(in kg) mass calculate #moles calculate “molal” concentration 13.61 grams 27.22 grams 40.83 grams 54.44 grams 68.05 grams (more prelab instruction on the reverse of this page) During the experiment, you will be heating a sodium acetate solution to boiling, and make repeated measurements of the following type: time, temperature, and capillary force(in millimeters). Prepare a data table in your notebook to collect these measurements. Prepare a second data table to collect the same measurements for distilled water. ___________________________________________ Day one: Each group will be assigned a certain concentration of sodium acetate solution to prepare, from the table of solution concentrations calculated during the prelab. Weigh the assigned mass of sodium acetate trihydrate. Add the massed compound to 100 grams of distilled water, in a ~250 mL beaker Measure the temperature of the water before, during and after the dissolution process. Make written observations before, during, and after the dissolution process. Stir to make sure dissolution is complete. If stirring alone is not adequate to dissolve all the crystals, begin heating them gently on a hot plate. Once the crystals are entirely dissolved, prepare a second beaker with distilled water, and turn the hotplate power up to about 80% max. Each lab partner is responsible for monitoring the temperature and capillary force of one of these two beakers, minute by minute throughout the heating process. Measure the temperature by stirring the solution briefly (so that all parts of the solution are at equal temperature) then record the temperature with a thermometer (to the nearest half degree) near the center of the solution. Measure the capillary force of the solution (in millimeters) by sticking a capillary tube in the top of the beaker, and measuring with a ruler the highest the solution climbs from the water’s surface. Take at least 8 capillary measurements between room temperature and 85 oC. Be cautious not to burn yourself at the higher temperatures. Record other types of observations of the solution in the margins of your data chart, such as the temperature when steam first appears, when convection currents appear in the water, when bubbles first appear, and when the solution reaches a rolling boil. At the rolling boil stage, you may turn off the hot plate. Label a large test tube with your group’s initials. Once your solution is cool to the touch, transfer to a labeled test tube, and cover with parafilm. If you finish early, begin graphing your data. See the instructions at the end of this assignment. Day 2: Your solution has been placed in the freezer overnight. Place the tube in a room temperature water bath, and record the temperature of the solution as it begins to melt, then as it begins to climb toward room temperature. Analysis and conclusions: (Day 1)Report the concentration and boiling temperature of your solution to the class, by writing these values on the board. (Day 2)Report the concentration and freezing/melting temperature of your solution to the class by writing these values on the board. Each lab partner should prepare a heating curve graph for their own data (time vs temperature) Include labels along the time axis highlighting other important observations. Include labels on the temperature axis showing boiling point temperature. Draw a graph of temperature vs capillary force, which includes at least 8 points scattered across the time of the experiment. Using the data from the entire class, prepare a pair of graphs of solution concentration vs. melting point, and solution concentration vs. boiling point. Write at least two paragraphs of summary conclusions. At minimum, this should describe: The relationship between solution concentration and boiling point. The relationship between solution concentration and melting point. The relationship between temperature and capillary force. An explanation for the observed relationships (above) in terms of intermolecular forces, and changes in the strengths of those forces with changing temperature. This last part should demonstrate your understanding of the topics covered in chapter 14 of the text. Finally, comment on the quality of your data, and the degree to which it may limit the strengths of your conclusions. What changes would you suggest for improving the quality of the data?

