Land use, soil erosion, and water protection in the Jeneberang
advertisement

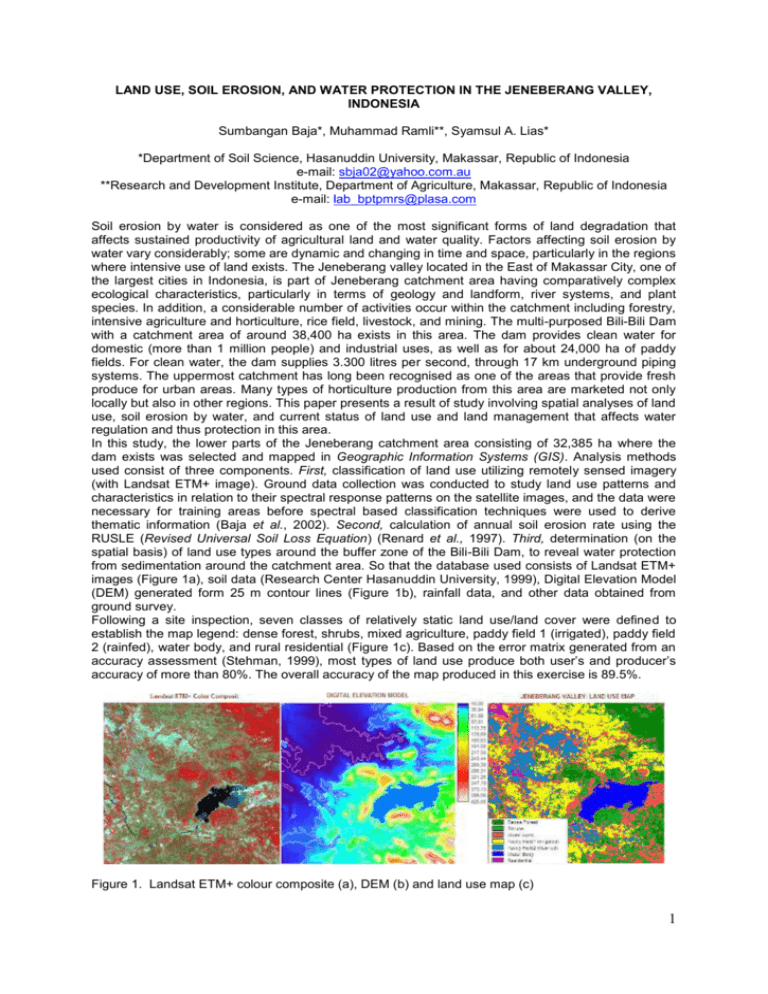
LAND USE, SOIL EROSION, AND WATER PROTECTION IN THE JENEBERANG VALLEY, INDONESIA Sumbangan Baja*, Muhammad Ramli**, Syamsul A. Lias* *Department of Soil Science, Hasanuddin University, Makassar, Republic of Indonesia e-mail: sbja02@yahoo.com.au **Research and Development Institute, Department of Agriculture, Makassar, Republic of Indonesia e-mail: lab_bptpmrs@plasa.com Soil erosion by water is considered as one of the most significant forms of land degradation that affects sustained productivity of agricultural land and water quality. Factors affecting soil erosion by water vary considerably; some are dynamic and changing in time and space, particularly in the regions where intensive use of land exists. The Jeneberang valley located in the East of Makassar City, one of the largest cities in Indonesia, is part of Jeneberang catchment area having comparatively complex ecological characteristics, particularly in terms of geology and landform, river systems, and plant species. In addition, a considerable number of activities occur within the catchment including forestry, intensive agriculture and horticulture, rice field, livestock, and mining. The multi-purposed Bili-Bili Dam with a catchment area of around 38,400 ha exists in this area. The dam provides clean water for domestic (more than 1 million people) and industrial uses, as well as for about 24,000 ha of paddy fields. For clean water, the dam supplies 3.300 litres per second, through 17 km underground piping systems. The uppermost catchment has long been recognised as one of the areas that provide fresh produce for urban areas. Many types of horticulture production from this area are marketed not only locally but also in other regions. This paper presents a result of study involving spatial analyses of land use, soil erosion by water, and current status of land use and land management that affects water regulation and thus protection in this area. In this study, the lower parts of the Jeneberang catchment area consisting of 32,385 ha where the dam exists was selected and mapped in Geographic Information Systems (GIS). Analysis methods used consist of three components. First, classification of land use utilizing remotely sensed imagery (with Landsat ETM+ image). Ground data collection was conducted to study land use patterns and characteristics in relation to their spectral response patterns on the satellite images, and the data were necessary for training areas before spectral based classification techniques were used to derive thematic information (Baja et al., 2002). Second, calculation of annual soil erosion rate using the RUSLE (Revised Universal Soil Loss Equation) (Renard et al., 1997). Third, determination (on the spatial basis) of land use types around the buffer zone of the Bili-Bili Dam, to reveal water protection from sedimentation around the catchment area. So that the database used consists of Landsat ETM+ images (Figure 1a), soil data (Research Center Hasanuddin University, 1999), Digital Elevation Model (DEM) generated form 25 m contour lines (Figure 1b), rainfall data, and other data obtained from ground survey. Following a site inspection, seven classes of relatively static land use/land cover were defined to establish the map legend: dense forest, shrubs, mixed agriculture, paddy field 1 (irrigated), paddy field 2 (rainfed), water body, and rural residential (Figure 1c). Based on the error matrix generated from an accuracy assessment (Stehman, 1999), most types of land use produce both user’s and producer’s accuracy of more than 80%. The overall accuracy of the map produced in this exercise is 89.5%. Figure 1. Landsat ETM+ colour composite (a), DEM (b) and land use map (c) 1 Soil erosion in this area has become one of very important factors affecting water flow, water quality, and quantity in the main river and in the Bili-Bili Dam since a very remarkable natural disaster – a gigantic landslide took place on March 26, 2004 on the caldera wall of Mt. Bawakaraeng (2,830 m a.s.l.) in the uppermost reach of the Jeneberang River. The huge mass of debris yielded from this gigantic landslide traveled about 7 km down the Jeneberang River. The volume of the slide mass was estimated at about 240 million cubic meters with a head width of 1,600 m, a height 700 to 800 m, and a thick of approximately 200 m (Tsuchiya et al., 2004). This landslide has brought about many adverse effects to land and water ecology and human activities in the region. Sediment delivery occurs continuously through the main river (Jeneberang) to the middle parts down to the Bili-Bili Dam. Based on the calculation of potential annual soil erosion rate, it was found that the dominant soil erosion rate is that area with a very low category (< 5 ton/ha/yr) comprises 20.727 ha, followed by very high category (> 100 ton/ha/yr) covers a total area of 5.330 ha, medium category (10–50 ton/ha/yr) 2.608 ha, and high (50–100 ton/ha/yr) 1.997 ha (Figure 2a). The dam covers an area of 1.737 ha. The data reveal that with such a high potential annual erosion rate, regulation of land cover in the area around the river systems and the dam is indispensable to prevent excessive sedimentation in the water. Spatial matching between buffer zones for the Bili-Bili Dam (see Figure 2) and existing land use (see Figure 1b) shows that for the 100 m buffer, mixed agriculture dominates the area (190 ha from a total buffer area of 291 ha). This is in contrast to what recommended in the Law No 26 2007 on Spatial Planning, where it should be protected (used for forest, for example). Further, buffer areas of 100– 250m and 250–500m are also dominated by mixed agriculture and shrubs. Buffer Zone and Land Use 600 Forest Shrubs Mixed Agr Area (ha) 400 Rice Field Water Resident 200 0 1-100m 100-250m 250-500m 500-1000m Buffer Zone Figure 2. Map of potential annual soil loss (a), dam buffer zone (b), and the histogram of land use distribution on different buffer zones (c). The study shows that the lower Jeneberang Valley around the Bili-Bili dam at the present time generally undergoes a low erosion rate, as more than 60% of the area tested has a potential soil loss rate of less than 5 ton/ha/year. However, the area around the dam experiences relatively high potential soil loss that may cause high sedimentation rate into the water bodies. So that, it requires an appropriate land management in the land area having a high potential risk as indicated in potential soil loss map. Present land use classification reveals that the area that should be allocated as 100 m buffer zone around the dam consists of various land use types, but is dominated by mixed agriculture. Very limited buffer area of forest and scrubs is found around the water bodies, in order to meet the requirements of 30% of protected area on a catchment. For the land to be sustainable and water to be protected, care must be given to the land areas around the 100 m buffer zone (both from main river and the dam), particularly in the spatial allocation of land use for future development. References: Baja, S., Chapman, D. M., and Dragovich, D. 2002. Using GIS and remote sensing for assessing and mapping the present status of land use and land qualities in the lower Hawkesbury-Nepean Catchment, Australia. Geocarto International, 17: 15– 24. Renard, K.G., Foster, G.R., Weesies, G.A., McCool, D.K. and Yoder, D.C. 1997. Predicting Soil Erosion by Water: A guide to Conservation Planning with the Revised Universal Soil Loss Equation (RUSLE). USDA Agriculture Handbook No 703, Washington D.C. Research Centre, Hasanuddin University. 1999. Agricultural Soil Survey of Bili-Bili Irrigation Project Area. Research Centre, Hasanuddin University, Ujung Pandang. 89 pp. Stehman, S.V. 1999. Basic probability sampling design for thematic map accuracy assessment. International Journal of Remote Sensing, 20: 2423–2441. Tsuchiya, S., Koga, S., Sasahara, K., Matsui, M., Nakahiro, M., Watanabe, H., Shima, H., and Yoshida, K. 2004. Reconnaissance of the gigantic landslide occurred on Mt. Bawakaraeng in the south Sulawesi state of Indonesia and unstable debris sedimentation (prompt report). Journal of the Japan Society of Erosion Control Engineering, 57: 3. 2


