Inequalities refer to problems which have any of these four symbols
advertisement
Inequalities: Number Line Graphs
Inequalities refer to problems that have any of these four symbols instead of an equal sign.
Less than (<)
Less than or equal to ()
Greater than (>)
Greater than or equal to ()
If there is only one variable (x, y, etc.), then this is going to be graphed on a number line. There will be a
circle on the number (called the endpoint) and if you pretend that the inequality is an arrow head, it will tell
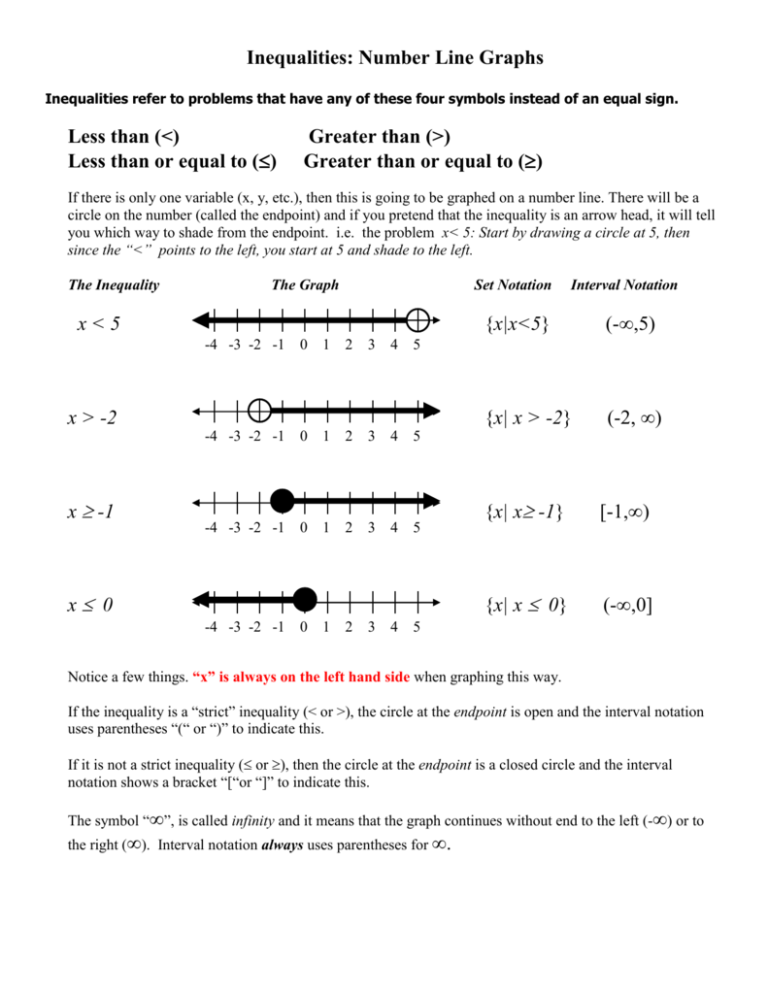
you which way to shade from the endpoint. i.e. the problem x< 5: Start by drawing a circle at 5, then
since the “<” points to the left, you start at 5 and shade to the left.
The Inequality
The Graph
Set Notation
x<5
-4 -3 -2 -1
0
1
2
3
4
5
-4 -3 -2 -1
0
1
2
3
4
5
-4 -3 -2 -1
0
1
2
3
4
5
x > -2
x -1
x 0
-4 -3 -2 -1
0
1
2
3
4
Interval Notation
{x|x<5}
(-,5)
{x| x > -2}
(-2, )
{x| x -1}
[-1,)
{x| x 0}
(-,0]
5
Notice a few things. “x” is always on the left hand side when graphing this way.
If the inequality is a “strict” inequality (< or >), the circle at the endpoint is open and the interval notation
uses parentheses “(“ or “)” to indicate this.
If it is not a strict inequality ( or ), then the circle at the endpoint is a closed circle and the interval
notation shows a bracket “[“or “]” to indicate this.
The symbol “”, is called infinity and it means that the graph continues without end to the left (-) or to
the right (). Interval notation always uses parentheses for .
Inequalities: Number Line Graphs
This chart tells you which way to shade and whether you use a
solid dot or an open dot at the endpoint.
Shading Direction
E
n
d
p
o
i
n
t
left
open circle
closed circle
right
<
>
