Exercise 2: Neo
advertisement
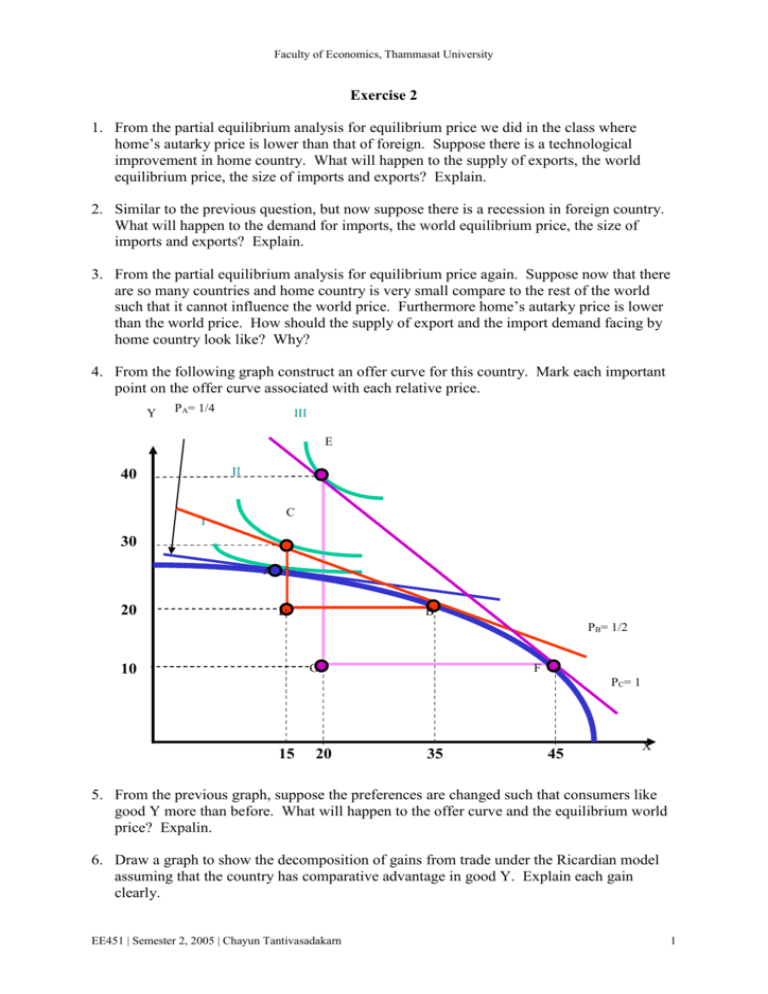
Faculty of Economics, Thammasat University Exercise 2 1. From the partial equilibrium analysis for equilibrium price we did in the class where home’s autarky price is lower than that of foreign. Suppose there is a technological improvement in home country. What will happen to the supply of exports, the world equilibrium price, the size of imports and exports? Explain. 2. Similar to the previous question, but now suppose there is a recession in foreign country. What will happen to the demand for imports, the world equilibrium price, the size of imports and exports? Explain. 3. From the partial equilibrium analysis for equilibrium price again. Suppose now that there are so many countries and home country is very small compare to the rest of the world such that it cannot influence the world price. Furthermore home’s autarky price is lower than the world price. How should the supply of export and the import demand facing by home country look like? Why? 4. From the following graph construct an offer curve for this country. Mark each important point on the offer curve associated with each relative price. Y PA= 1/4 III E 40 30 II C I A 20 D B PB= 1/2 10 G F PC= 1 15 20 35 45 X 5. From the previous graph, suppose the preferences are changed such that consumers like good Y more than before. What will happen to the offer curve and the equilibrium world price? Expalin. 6. Draw a graph to show the decomposition of gains from trade under the Ricardian model assuming that the country has comparative advantage in good Y. Explain each gain clearly. EE451 | Semester 2, 2005 | Chayun Tantivasadakarn 1 Faculty of Economics, Thammasat University 7. Under the general assumption of the neoclassical model, draw a graph to show the gains from trade when good X and Y are complements. Does the total gains from trade still consist of consumption gain and production gain? Why? 8. Under the general assumption of the neoclassical model, except that the production possibility curve is rigid and fixed at the autarky output, XA and YA [i.e., the PPC looks like a rectangular shape with (XA, YA) locates at the upper right corner]. Draw a graph to show the gains from trade. Does the total gains from trade still consist of consumption gain and production gain? Why? EE451 | Semester 2, 2005 | Chayun Tantivasadakarn 2
