TRASH PIZZA PROJECT
advertisement
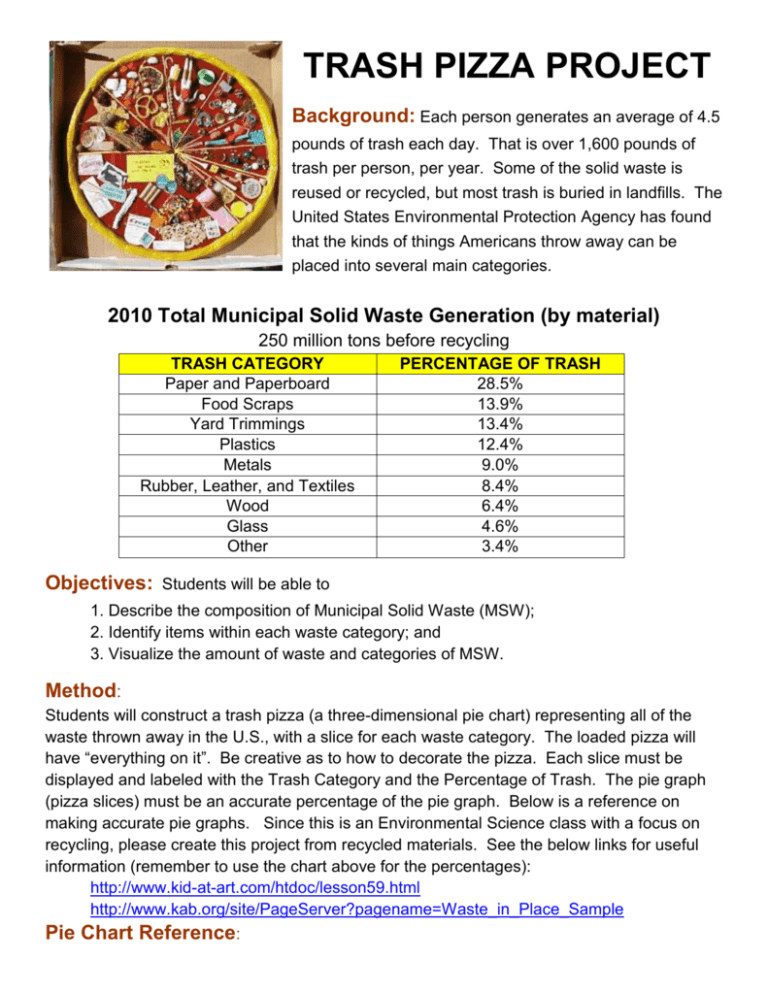
TRASH PIZZA PROJECT Background: Each person generates an average of 4.5 pounds of trash each day. That is over 1,600 pounds of trash per person, per year. Some of the solid waste is reused or recycled, but most trash is buried in landfills. The United States Environmental Protection Agency has found that the kinds of things Americans throw away can be placed into several main categories. 2010 Total Municipal Solid Waste Generation (by material) 250 million tons before recycling TRASH CATEGORY Paper and Paperboard Food Scraps Yard Trimmings Plastics Metals Rubber, Leather, and Textiles Wood Glass Other PERCENTAGE OF TRASH 28.5% 13.9% 13.4% 12.4% 9.0% 8.4% 6.4% 4.6% 3.4% Objectives: Students will be able to 1. Describe the composition of Municipal Solid Waste (MSW); 2. Identify items within each waste category; and 3. Visualize the amount of waste and categories of MSW. Method: Students will construct a trash pizza (a three-dimensional pie chart) representing all of the waste thrown away in the U.S., with a slice for each waste category. The loaded pizza will have “everything on it”. Be creative as to how to decorate the pizza. Each slice must be displayed and labeled with the Trash Category and the Percentage of Trash. The pie graph (pizza slices) must be an accurate percentage of the pie graph. Below is a reference on making accurate pie graphs. Since this is an Environmental Science class with a focus on recycling, please create this project from recycled materials. See the below links for useful information (remember to use the chart above for the percentages): http://www.kid-at-art.com/htdoc/lesson59.html http://www.kab.org/site/PageServer?pagename=Waste_in_Place_Sample Pie Chart Reference: 1. Using the Municipal Solid Waste Trash Categories list and their percentages, convert each percentage into degrees by multiplying it by 3.6, which is the number you arrive at when you divide 360 (degrees in a circle) by 100 (total amount in percentage). 2. Add the total of all items to make certain that the total is at least 360 degrees. If not, recalculate the degrees for each item. 3. Using your pizza circle, divide the circle into segments using the chart that you have just created. Mark the number of degrees by drawing a line from the center to the edge. Line this with the protractor as 0 degrees. Mark the number of degrees desired and draw a line from the center. 4. Continue through your numbers, using the previously made line as the 0 degree beginning and measuring out the necessary number of degrees for each category. 5. Label each section with the Trash Category and Percentage of Trash. Grading: Project will be graded per the grading rubric below. Projects turned in more than one day late will result in a below average grade of zero for timeliness, however will receive credit for completing the project. Students will only have 1 week after the project due date to turn the project in. After 1 week late, students will receive a zero on the total project. GRADING CATEGORY BELOW AVERAGE AVERAGE EXEMPLARY TOTA L Project handed in more Project handed in than 1 day late 1 day late Timeliness 0 points 10 points Little or no effort in project, Some effort in project, Creativity illegible writing, did not legible writing, met some meet requirements of the requirements of the and project. project. Organization 0 – 10 points 10 - 15 points Structure Presentation Little or no structure in the design of the pie graph, measurements are incorrect, no clear vision of final project No movement, displayed no eye contact with audience, little or no poise Project handed in on time 25 points Effort is outstanding, writing is neat, met all requirements of the project. 15 – 25 points Outstanding structure Some structure in the and design of the pie design of the pie graph, graph, some measurements are measurements are incorrect, has some accurate, clear vision vision of final project of final project. 10 - 15 points 15 – 25 points Little or sporadic movement, inconsistent eye contact with audience, displays little or no nervousness Movement is fluid, holds attention of audience, relaxed and self-confident References: www.kab.org (© Keep America Beautiful, Inc. 1996) and www.kid-at-art.com
