Spectrophotometic Determination of Copper ε
advertisement
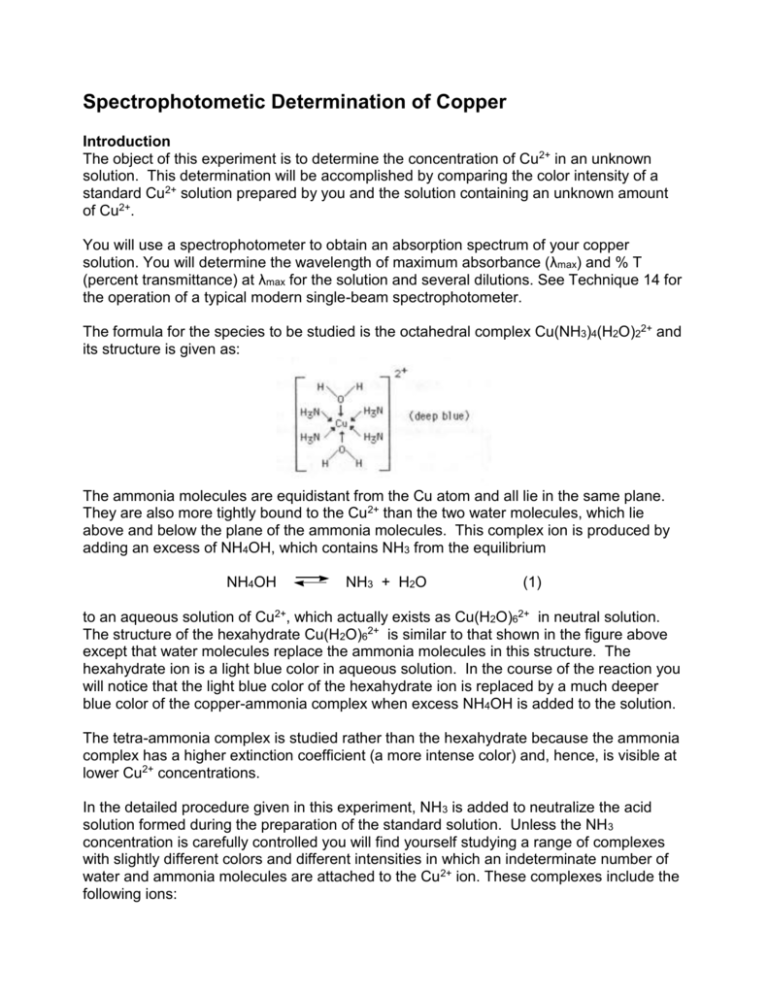
Spectrophotometic Determination of Copper Introduction The object of this experiment is to determine the concentration of Cu2+ in an unknown solution. This determination will be accomplished by comparing the color intensity of a standard Cu2+ solution prepared by you and the solution containing an unknown amount of Cu2+. You will use a spectrophotometer to obtain an absorption spectrum of your copper solution. You will determine the wavelength of maximum absorbance (λmax) and % T (percent transmittance) at λmax for the solution and several dilutions. See Technique 14 for the operation of a typical modern single-beam spectrophotometer. The formula for the species to be studied is the octahedral complex Cu(NH3)4(H2O)22+ and its structure is given as: The ammonia molecules are equidistant from the Cu atom and all lie in the same plane. They are also more tightly bound to the Cu2+ than the two water molecules, which lie above and below the plane of the ammonia molecules. This complex ion is produced by adding an excess of NH4OH, which contains NH3 from the equilibrium NH4OH NH3 + H2O (1) to an aqueous solution of Cu2+, which actually exists as Cu(H2O)62+ in neutral solution. The structure of the hexahydrate Cu(H2O)62+ is similar to that shown in the figure above except that water molecules replace the ammonia molecules in this structure. The hexahydrate ion is a light blue color in aqueous solution. In the course of the reaction you will notice that the light blue color of the hexahydrate ion is replaced by a much deeper blue color of the copper-ammonia complex when excess NH4OH is added to the solution. The tetra-ammonia complex is studied rather than the hexahydrate because the ammonia complex has a higher extinction coefficient (a more intense color) and, hence, is visible at lower Cu2+ concentrations. In the detailed procedure given in this experiment, NH3 is added to neutralize the acid solution formed during the preparation of the standard solution. Unless the NH3 concentration is carefully controlled you will find yourself studying a range of complexes with slightly different colors and different intensities in which an indeterminate number of water and ammonia molecules are attached to the Cu2+ ion. These complexes include the following ions: Cu(H2O)62+ Cu(NH3)(H2O)52+ Cu(NH3)4(H2O)22+ Thus, we force the reaction of Cu(H2O)62+ with NH3 to completion by adding an excess of NH3. Procedure Work in pairs. Be sure to bring a calculator that has a log function to the lab !! Each student is to turn in a clean, dry, small test tube labelled with his/her name on it to a TA BEFORE the pre-lab lecture. Each group should obtain a 50.00-mL volumetric flask and a 25.00-mL pipet. Make sure the volumetric flask is CLEAN; it is not necessary that it is dry. In this experiment you will prepare an initial copper standard solution using a copper solution of known concentration that will be provided. The absorption spectrum of the copper solution will be measured in order to determine the wavelength of maximum absorbance (λmax). A set of calibration standards will be prepared by doing serial dilutions from your initial copper standard solution (your first solution will be diluted to make your second solution, your second solution will be diluted to make your third solution, ….). A calibration curve will be generated using these solutions. Your calibration curve must be reviewed by your instructor or a teaching assistant before you leave the lab. A solution of unknown concentration will be determined using the calibration curve. Note: It is extremely important to use very clean and dry small test tubes for all measurements in the Spectronic 20. The instrument measures how much light makes it through a sample. It cannot tell whether the light is blocked due to the solution, a label on the test tube and/or dirt or fingerprints on the test tube. If paper labels are used, place them only at the top of the test tube so they do not block the light beam. Always wipe the outside of the test tube with a slightly damp paper towel before each measurement. Part A. Preparation of Initial Cooper Standard Solution: 1. Obtain approximately 35 mL of copper standard solution in a clean, dry, small beaker. The container will state the copper concentration. Record this concentration in your notebook. 2. Clean a 50.00-mL volumetric flask. Be sure to rinse it well with deionized water (i.e. at least four times). 3. Clean a 25.00-mL pipette and then rinse it with a little of your copper solution (~ 5 mL). Pipet 25.00 mL of the provided copper standard into the clean 50.00-mL volumetric flask. 4. In the hood slowly add about 2 mL concentrated ammonia (NH3) solution, swirling to mix the contents. The solution will turn blue and, at first, a light blue precipitate will form. As you continue adding the ammonia, the precipitate will dissolve and the solution will turn a deep blue color. Add an additional 1 mL of the concentrated NH3 solution. Mix well. Add DI water until the solution almost reaches the ring on the neck of the flask. At that point continue adding water dropwise until the solution exactly reaches the mark. Replace the cap on the volumetric flask and mix well by inverting at least six times. This is your standard Cu2+ solution. Calculate its concentration in molarity (moI/L) and in mg Cu/mL. Part B. Measurement of Cu2+ Absorption Spectrum: 1. Place 4 mL of DI water into a clean, small test tube. Add 40 drops of concentrated NH3 solution. Mix well. (Note: Do not use a cork to stopper the test tube since it may react with the ammonia solution. Stir with a clean stirring rod or cover with Parafilm and shake.) Set the test tube aside. This is your blank solution. 2. Place 5 mL of your standard Cu2+ solution in a second small test tube. 3. Set the wavelength dial of the Spectronic 20 spectrophotometer to 360 nm. 4. Zero and blank adjustment for the Spectronic 20: a. With the sample chamber empty and the sample holder door closed, adjust the zero control (left) knob so that the meter reads 0 % T (0 % Transmittance). b. Place the test tube containing the blank solution into the sample chamber; close the door. Adjust the light control (right) knob so the meter reads 100% T. c. Place the test tube containing the copper solution into the sample holder; close the cover. Without changing either of the knobs, record the value of % T displayed on the meter to +/- 0.2 % T. Note: Since the %T scale is linear and easier to read, it is more practical to record %T than absorbance (A) when using a spectrophotometer. If any of the % T measurements of a sample are greater than 100 %, check the cleanliness of your blank solution test tube and redo steps a & b. 5. Change the wavelength setting to 380 nm and record the % T for your standard copper solution to +/- 0.2 % T. Note: Each time you change the wavelength, check the zero and balance as in part 4 above. 6. Continue recording % T readings at 20 nm intervals up to 660 nm. For each wavelength setting, rezero and rebalance the spectrophotometer. 7. For each of the wavelengths, calculate absorbance (A) using the following equation: A = log10 (100% / % T) (2) Plot A (y-axis) versus wavelength (x-axis). From your plot, find the wavelength of maximum absorbance. Hint: The A vs. wavelength plot should peak at this point. Use this wavelength for the rest of today's measurements. Part C. Preparation of a Calibration Curve: 1. Transfer your standard copper solution to a clean, dry Erlenmeyer flask. Label the flask. 2. Carefully rinse out the volumetric flask: Fill about one-third with DI water. Replace the cap and mix well. Drain and discard the rinse. Repeat. Rinse the volumetric flask at least six times. It is not necessary to dry the flask. 3. Rinse the 25.00-mL pipet with about 5 mL of your standard Cu2+ solution. Discard the rinse. 4. Using the pipet, transfer 25.00 mL of your standard Cu2+ solution into the volumetric flask. Add 5 mL of concentrated NH3 solution. Fill to the mark with DI water. Mix well. Calculate the concentration of this new solution. 5. Measure % T for this solution to +/- 0.2 % T. For best results in using the spectrophotometer when varying concentrations, values for %T should lie in the range from 30% to 70%. The potential error is minimal in this range, but it increases as readings are made further outside these limits. This means that there is greater error in readings at 5 % T or 95 % T than at 25 % T or 75 % T. 6. Transfer this diluted copper solution to a clean, dry Erlenmeyer flask. Label the flask. Prepare 2 more solutions by diluting the last Cu2+ solution prepared, as in steps 2 - 4 above. Carefully rinse the volumetric flask each time. Measure % T for each of these known solutions. Use the wavelength of maximum absorption determined earlier. 7. For each of your known solutions, calculate absorbance (A) using equation above. 8. Plot A (y-axis) versus [Cu2+] (x-axis) for the known solutions and your blank solution. Your plot will have 5 data points. On graph paper in your notebook plot mixture density versus % antifreeze for the standard samples. Draw the best possible straight line through the data points, but do not extend the line beyond the most concentrated solution (that is, don't extrapolate). Do not simply connect the dots on your graph. This is your calibration curve. From the best straight line through the data points obtain the molar extinction coefficient. Have your instructor or a teaching assistant review your graph before you leave lab today. (Note: You may want to replot your graph after lab using a computer-plotting program (e.g.- Excel, SigmaPlot, PsiPlot, Cricket Graph, etc.). Part D. Measurement of Unknown: 1. Each student will measure his/her own unknown. The data for the known solutions may be shared. 2. Place about 5 mL of your unknown solution into a clean dry small test tube. Zero and blank the Spectronic 20. Measure % T for your unknown at the wavelength of maximum absorption to +/- 0.2 % T. Calculate A (eq. 2) for your unknown. 3. Using your calibration curve, determine the molar concentration of your unknown. Also calculate its concentration in mg/mL. 4. Report the molarity of Cu2+ in your unknown as well as its concentration in mg Cu / mL solution. 5. DO NOT POUR ANY OF YOUR SOLUTIONS INTO THE SINK! Pour all of your waste solutions into the laboratory waste container in the hood. Be sure to return the pipettes and the volumetric flask. Calculations: Concentrations This experiment involves making a number of dilutions. When making dilutions, remember that a molar concentration (M) is expressed as n/V, where n is the number of moles of solute in solution and V is the volume of the solution in liters. When a definite volume of solution is diluted, V is increased, but n remains constant. Consequently, if the initial concentration is C1 = n/V1 and the concentration after dilution is C2 = n/V2 then n = C1V1 and n = C2V2 so C1V1 = C2V2 (3) Using eq. 3 if any three values are known, the fourth may be determined. For example, if you put 10.00 mL of 0.50 M solution into a 100.0 mL volumetric flask and dilute to the mark, you can determine the concentration of your diluted solution (0.50 M)(10.00 mL) = (100.0 mL) C2 C2 = (0.50 M) x (10.00 mL) = 0.050 M 10.00 mL Note: When using eq. 3 you may use mL for the volume unit as long as you use mL consistently in the equation. The volumes do not need to be converted to liters, since the units cancel. Absorbance from % T: Suppose you find % T for a solution to be 49.2 % T. Using eq. 2, you can convert this to absorbance (A): A = log10 (100 % T / % T) A = log10 (100 % T / 49.2 % T) A = log10 (2.03) = 0.31 Note: A = 0.0 for a sample with 100 % T (no absorbance when all light passes through the sample) and A = 2.0 for a sample with 1.0 % T (high absorbance when essentially no light is transmitted through the sample). Beer’s Law Plot The relationship between concentration and absorbance is described by the Beer-Lambert Law: A=εbC (4) or by A = a b Cm (5) where A = absorbance, b = optical path length in cm, C = molar concentration, Cm = concentration in mg/mL. ε is called the molar absorptivity and a is the specific absorptivity. Suppose you have a substance that follows Beer's law for concentrations of 0.01 M and less. A perfect set of data, obtained for solutions of known concentration, might be like that appearing in Table 1. The graph of absorbance (A) vs concentration (G) from the data in Table 1 is shown in Figure 1. Table 1. Sample Data C (M) 0.0000 0.0080 0.0060 0.0040 0.0020 %T 100.0 22.9 33.1 47.9 69.2 A 0.00 0.64 0.48 0.32 0.16 Note: This is a perfect situation. Your data may not look as linear. Use your data to generate a Beer’s Law plot. Concentration of the Unknown Solution The concentration of Cu2+ in the unknown can be determined graphically using the calibration curve. Alternatively, the calibration data may be plotted using a graphics or spreadsheet program. When determining the concentration, be sure to use the equation for a straight line, y = mx + b, and consider the y-intercept in your calculation. The equation for the line as determined by the program, may be used to algebraically calculate the unknown concentration. In the above figure an unknown was to measure 25.1 %T or an absorbance of 0.40. The dotted lines show that the concentration of the unknown is 0.050 M. Report your unknown concentration in molarity and in Cu mg / mL solution. The unknown report is to be turned in at the beginning of the next lab period. Postlab Exercises 1. If a 2.73 M solution of KMnO4 has a transmittance of 64.37%, what is the absorbance of the solution? 2. If a 0.8148 M solution of a Cu complex has a transmittance of 38.7%, what is the molar concentration of the Cu complex in a solution that has an absorbance of 0.213? 3. A 0.0404 M solution of KMnO4 has a transmittance of 66.19% in a 2.000-cm cell. What is the extinction coefficient for this solution?
