6-5 Conditional Probability
advertisement
7-3 Part I: Conditional Probability,
Intersection of Events
CONDITIONAL EVENTS
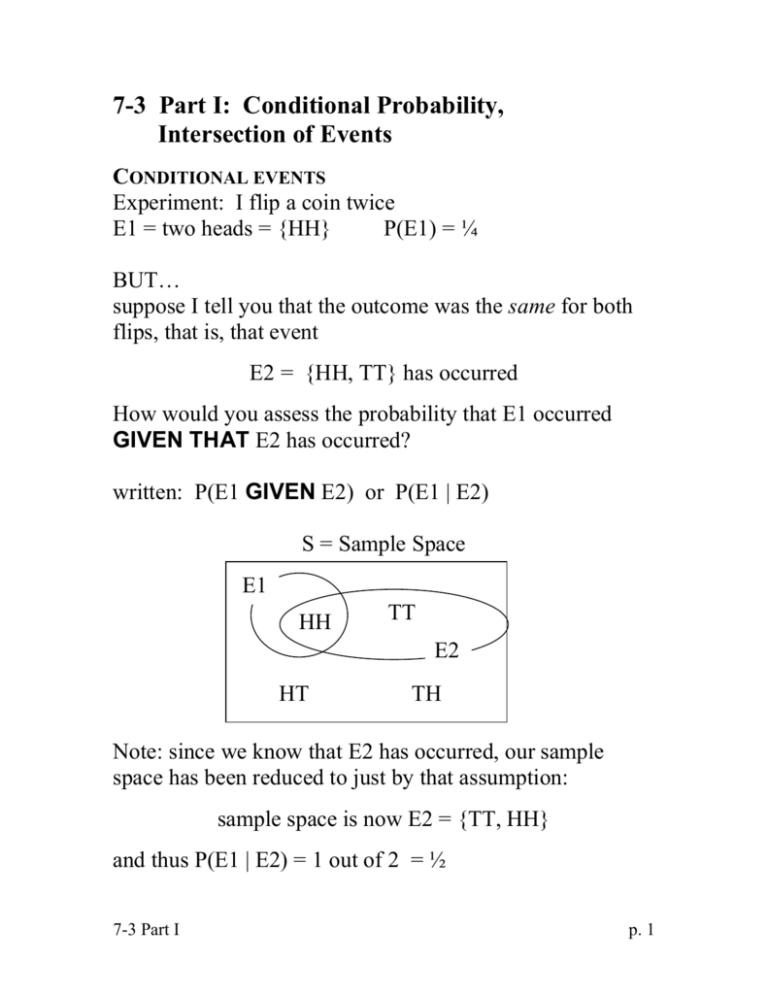
Experiment: I flip a coin twice
E1 = two heads = {HH}
P(E1) = ¼
BUT…
suppose I tell you that the outcome was the same for both
flips, that is, that event
E2 = {HH, TT} has occurred
How would you assess the probability that E1 occurred
GIVEN THAT E2 has occurred?
written: P(E1 GIVEN E2) or P(E1 | E2)
S = Sample Space
E1
HH
TT
E2
HT
TH
Note: since we know that E2 has occurred, our sample
space has been reduced to just by that assumption:
sample space is now E2 = {TT, HH}
and thus P(E1 | E2) = 1 out of 2 = ½
7-3 Part I
p. 1
In general:
P(E1 GIVEN E2) = P(E1 | E2) =
=
n (E1 E 2)
n (E 2)
n (E1 E 2) / n (S) P(E1 E 2) 1 4
=
=
=½
12
n (E 2) / n (S)
P(E 2)
P(A GIVEN B)
For any two events A and B
P(A | B) =
P ( A B)
P ( B)
THE AND (INTERSECTION) OF TWO EVENTS
Random experiment: flip coin twice
Event 1: E1 = get head on first throw = {HH, HT}
Event 2: E2 = get the same on both throws = {HH, TT}
Event E3: head on the 1st throw AND same on both throws
P(E 2 E1)
P(E1)
So: P(E1 E2) = P(E1)P(E2 | E1) = (1/2)(1/2) = ¼
We already know:
P(E2 | E1) =
P(A AND B)
For any two events A and B
P(A and B) = P(A B) = P(A)P(B | A)
7-3 Part I
p. 2
Probability Trees
A box contains 3 blue and 2 white balls. Two balls are
drawn in succession, without replacement. Find the
probability of drawing a white ball on the second draw.
Event notation: B1 = blue on first draw
W2 = white on second draw, etc.
Way 1: P(W2) = P(W1)P(W2|W1) + P(B1)P(W2|B1)
=
(2/5) (1/4)
+ (3/5) (2/4)
= 8/20 = 2/5
Way 2: first draw a tree that completely analyzes the
problem
P(W1W2)
P(W2 | W1)
P(W1)
2/5
1/4
W1
W2
2/51/4 = 1/10
3/4
B2 P(W1B2)=3/10
Start
1/2
3/5
W2
B1
3/10
1/2
B2
3/10
So P(W2) = 1/10 + 3/10 = 4/10 = 2/5
Can also get P(B2) = 3/10 + 3/10 = 6/10 = 3/5 (naturally!)
7-3 Part I
p. 3
Probability tables
probabilities can be displayed in a standard tabular form
often starting as tables of counts
see the following classification of 200 adults
according to gender and educational attainment
expressed as an empirical probability table ( 200):
Education
Elementary
Secondary
College
Totals
Male
.11
.22
.11
.44
Female
.195
.28
.085
.56
Totals
.305
.5
.195
1
Vocabulary:
the darkly shaded cells are called joint probabilities
another name for the probability of the AND of two events
the lightly shaded cells are called marginal probabilities
(because they are shown in the margins of the table)
the marginal probabilities represent certain totals of joint
probabilities, as shown.
Compute some probabilities (C=College F=Female M=Male):
P(C) = .195
P(C | F) = P(C F)/P(F) = .085/.56 = .15
P(C | M) = P(C M)/P(M) = .11/.44 = .25
Notice that a conditional probability is:
(a joint probability) (a marginal probability)
7-3 Part I
p. 4

