Meteorological Monsters
advertisement
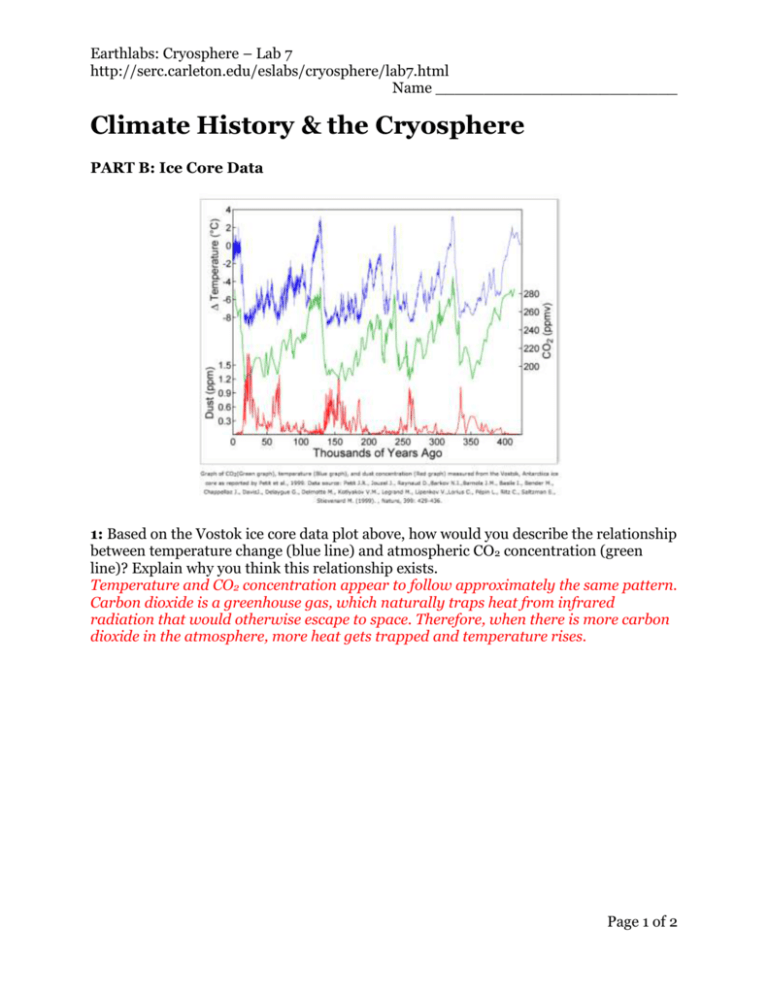
Earthlabs: Cryosphere – Lab 7 http://serc.carleton.edu/eslabs/cryosphere/lab7.html Name _________________________ Climate History & the Cryosphere PART B: Ice Core Data 1: Based on the Vostok ice core data plot above, how would you describe the relationship between temperature change (blue line) and atmospheric CO2 concentration (green line)? Explain why you think this relationship exists. Temperature and CO2 concentration appear to follow approximately the same pattern. Carbon dioxide is a greenhouse gas, which naturally traps heat from infrared radiation that would otherwise escape to space. Therefore, when there is more carbon dioxide in the atmosphere, more heat gets trapped and temperature rises. Page 1 of 2 Earthlabs: Cryosphere – Lab 7 http://serc.carleton.edu/eslabs/cryosphere/lab7.html 2: Based on the data from the last 100 years and the various predicted scenarios for the next 100 years shown in this plot, do you think that people should be concerned about rises in atmospheric CO2 concentration and average global temperatures? Explain why or why not. Answers will vary, but students should see that even if CO2 emissions remain constant (the best case scenario), the global surface temperature will still increase by approximately half a degree by the year 2100. Predicted temperature increases for low, moderate, and high growth emission scenarios are significantly higher. Most would agree that any of these scenarios is a cause for concern. 3: What consequences do you think the cryosphere might experience if CO2 concentrations and average global temperatures continue to rise with respect to historical trends? Try to give specific examples. If CO2 concentrations and average global temperatures continue to rise, the cryosphere will likely experience significant melting. Melting snow and ice will cause more warming due to the ice-albedo feedback loop. Computer models predict that there may be no more sea ice left in the Arctic Ocean during summer within the next few decades. Thawing permafrost will release carbon dioxide and methane (two powerful greenhouse gases) into the atmosphere, which will act to further increase warming and melting. Melting land ice will lead to sea level rise. As glaciers and ice sheets melt, they add water to the oceans. As that water warms, it will expand, further contributing to sea level rise. If the entire Greenland Ice Sheet were to melt, global sea level would rise approximately 6.5 meters. If the West Antarctic Ice Sheet were to melt or move into the ocean, global sea level would rise approximately 8 meters. Page 2 of 2
