DOC - Europa
advertisement
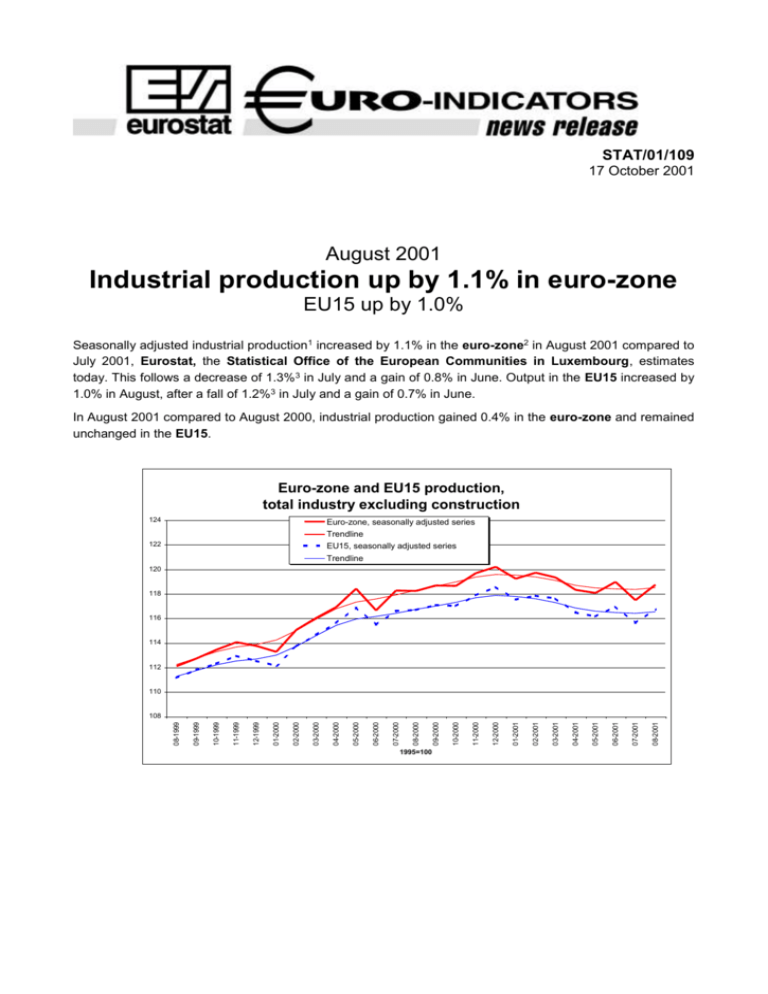
STAT/01/109 17 October 2001 August 2001 Industrial production up by 1.1% in euro-zone EU15 up by 1.0% Seasonally adjusted industrial production1 increased by 1.1% in the euro-zone2 in August 2001 compared to July 2001, Eurostat, the Statistical Office of the European Communities in Luxembourg, estimates today. This follows a decrease of 1.3%3 in July and a gain of 0.8% in June. Output in the EU15 increased by 1.0% in August, after a fall of 1.2%3 in July and a gain of 0.7% in June. In August 2001 compared to August 2000, industrial production gained 0.4% in the euro-zone and remained unchanged in the EU15. Euro-zone and EU15 production, total industry excluding construction 124 Euro-zone, seasonally adjusted series Trendline EU15, seasonally adjusted series Trendline 122 120 118 116 114 112 110 1995=100 08-2001 07-2001 06-2001 05-2001 04-2001 03-2001 02-2001 01-2001 12-2000 11-2000 10-2000 09-2000 08-2000 07-2000 06-2000 05-2000 04-2000 03-2000 02-2000 01-2000 12-1999 11-1999 10-1999 09-1999 08-1999 108 Monthly comparison After showing the strongest fall of all sectors in July 2001, durable consumer goods clearly recovered in August with a gain of 3.1% in the euro-zone and of 2.6% in the EU15. The capital goods index increased by 2.2% in both areas. Intermediate goods rose by 0.5% in the euro-zone and by 0.7% in the EU15, while nondurable consumer goods advanced by 0.3% and 0.5%, respectively. Only energy recorded a decrease: -0.3% in the euro-zone and -0.5% in the EU15. In August, industrial production increased in all reporting Member States for which data were available, except in Denmark (-2.4%) and in France (0.0%). The highest increases were observed in Ireland (5.8%), Luxembourg (4.9%), Spain (3.3%), Finland (3.0%) Portugal (2.3%) and Germany (2.1%). Annual comparison Capital goods increased by 2.4% in the euro-zone and by 1.7% in the EU15. Durable and non-durable consumer goods gained 0.7% and 1.6% respectively in the euro-zone and 1.0% and 1.8% in the EU15. Energy increased by 1.8% in the euro-zone and by 0.5% in the EU15, while intermediate goods fell by 2.0% and 2.7% respectively. Compared to August 2000 Luxembourg (5.5%), Portugal (2.9%), Spain (2.8%) and France (2.1%) recorded the highest increases, while UK (-2.3%), Finland (-1.9%), Italy and the Netherlands (both -1.5%) registered the strongest falls. 1. For methodology, see news release 38/2000, 23 March 2000 and for the currently used weights, see news release 78/2001, 20 July 2001. 2. Euro-zone: Belgium, Germany, Greece (since January 2001), Spain, France, Ireland, Italy, Luxembourg, the Netherlands, Austria, Portugal and Finland. Euro-zone data up to end 2000 cover the eleven Member States; with Greece’s entry into the euro-zone from the beginning of 2001, they cover the twelve Member States. The euro-zone is treated as an entity regardless of its composition. The growth rates for 2001 are calculated by comparing figures for the euro-zone at 12 in 2001 with figures for EUR11 + Greece in 2000. For analytical purposes, Eurostat has made available in its data base NewCronos historic series covering the current twelve Member States of the euro-zone since 1990. 3. Data for July and the previous months have been revised compared to the news release 98/2001, 24 September 2001. 4. Total industry (excluding construction). According to the Council Regulation 1165/98 Eurostat publishes national seasonally adjusted data if available (currently Belgium, Denmark, Germany, France, Ireland, Italy, the Netherlands, Sweden, the UK and Finland). For the other Member States Eurostat performs the adjustment. The seasonally adjusted euro-zone and EU15 series are calculated by aggregating the working days adjusted series from individual Member States and performing an adjustment for seasonal effects on these series. Therefore the seasonally adjusted figures for total industry (excluding construction) is based directly on the working day adjusted series coming from the Member States and not on an aggregation of the seasonally adjusted indices from the Member States. The euro-zone and EU15 seasonally adjusted growth rates might differ from the weighted growth rates of the individual Member States (see Methodology of the industrial production index). This procedure also implies that the aggregation of the overall figures is not based on the published details (intermediate, capital, durable, non-durable goods, energy). Working days adjusted figures are transmitted by all Member States except by Denmark. For this Member State, Eurostat performs the working days adjustment. Data for Denmark and Sweden do not cover electricity, gas and water supply Values of July and August 2001 might have been influenced by shifting holiday patterns. Figures and graphics available in PDF and Word Processed versions Issued by: Eurostat Press Office Fons THEIS, Philippe BAUTIER, Anette SIMES L-2920 LUXEMBOURG Tel: +352-4301 33 444 +352-4301 33 496 Fax: +352-4301 35 349 eurostat-pressoffice@cec.eu.int For further information on data: Carmen LIPP-LINGUA Tel.: +352-4301 35253 Fax: +352-4301 34359 carmen.lipp-lingua@cec.eu.int Christoph WALKNER Tel.: +352-4301 35598 Fax: +352-4301 34359 christoph.walkner@cec.eu.int Eurostat news releases on the Internet: http://europa.eu.int/comm/eurostat/
