Flow Measurements Using Orifice
advertisement
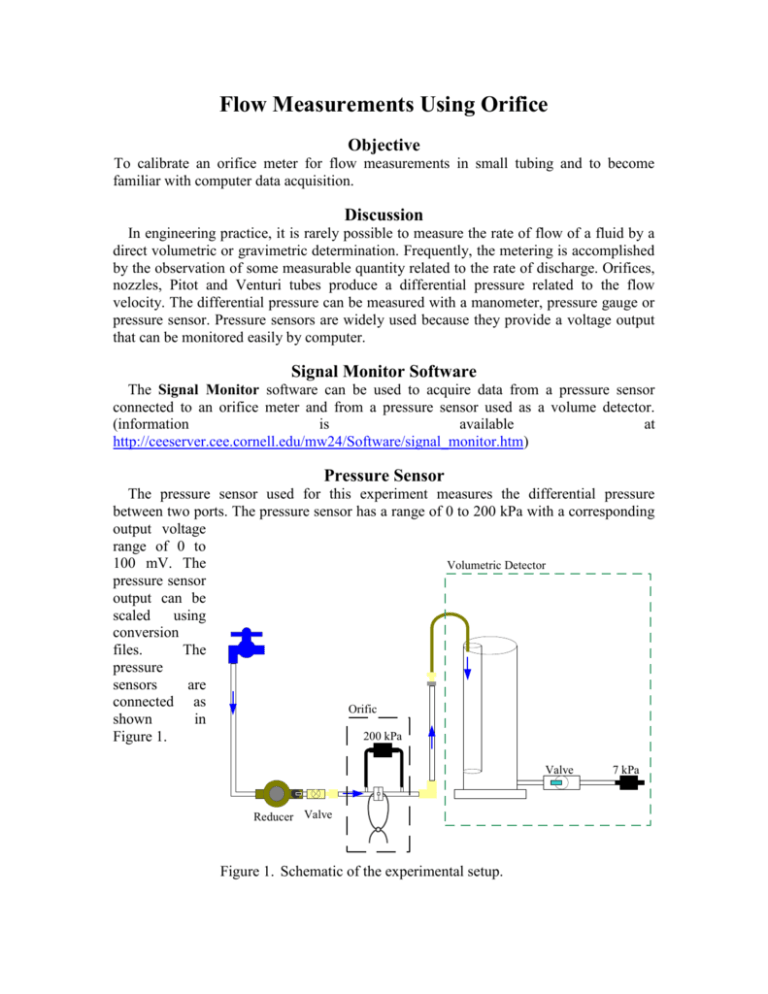
Flow Measurements Using Orifice Objective To calibrate an orifice meter for flow measurements in small tubing and to become familiar with computer data acquisition. Discussion In engineering practice, it is rarely possible to measure the rate of flow of a fluid by a direct volumetric or gravimetric determination. Frequently, the metering is accomplished by the observation of some measurable quantity related to the rate of discharge. Orifices, nozzles, Pitot and Venturi tubes produce a differential pressure related to the flow velocity. The differential pressure can be measured with a manometer, pressure gauge or pressure sensor. Pressure sensors are widely used because they provide a voltage output that can be monitored easily by computer. Signal Monitor Software The Signal Monitor software can be used to acquire data from a pressure sensor connected to an orifice meter and from a pressure sensor used as a volume detector. (information is available at http://ceeserver.cee.cornell.edu/mw24/Software/signal_monitor.htm) Pressure Sensor The pressure sensor used for this experiment measures the differential pressure between two ports. The pressure sensor has a range of 0 to 200 kPa with a corresponding output voltage range of 0 to 100 mV. The Volumetric Detector pressure sensor output can be scaled using conversion files. The pressure sensors are connected as Orific shown in 200 kPa Figure 1. Valve Reducer Valve Figure 1. Schematic of the experimental setup. 7 kPa Orifice Calibration The change in piezometric head resulting from the flow of a fluid through an orifice is obtained by application of the energy equation between a cross section upstream and a cross section at the vena contracta. Several different locations are commonly used for the pressure taps and the pressures measured are strongly dependent on the pressure tap Figure 2. . Location of the pressure taps on the location. Some kinetic energy is laboratory orifice meter. converted back to potential energy downstream from the vena contracta. The pressure tap locations in the laboratory orifice meter are configured as shown in Figure 2. The orifice equation contains an empirically determined coefficient, Korifice, that is a function of the orifice Reynolds number (based on the orifice diameter). Q K orifice Aorifice 2 gh 1.1 The orifice coefficient is a weak function of Reynolds number. Scope of Experiment In this laboratory you will calibrate one orifice plate. Procedure Pressure Sensor Scaling and Monitoring 1) Start the Signal Monitor software to monitor the pressure sensors. 2) Connect the high-pressure port of the 200 kPa pressure sensor to the middle row of ports. 3) Connect the high-pressure port of the 7 kPa pressure sensor to the upper row of ports. 4) Apply scaling to the sensors so that the 7 kPa sensor output is in mL of water using the volumetric detector and the 200 kPa sensor output is in cm. 5) Set the data rate to 1 Hz by averaging 50 points. Orifice Calibration 1) Connect the 200-kPa pressure sensor to the orifice meter. The high-pressure port should be connected to the upstream pressure tap (2.5 D upstream from orifice plate). The bore of the orifice plate is 1.59 mm. 2) Connect the 7-kPa pressure sensor to the port at the base of the volumetric detector. 3) Connect the orifice meter to the supply and drain lines. 4) Insert the drain line into the small tube at the top of the volumetric detector 5) Open the flow control valve very slowly! Water hammer from a surge of water through an air filled orifice tube can damage the pressure sensor. 6) After the tubing has filled with water and there is a small amount of water in the volumetric detector turn off the water and then subtract the offset voltage from both sensors. 7) Adjust the flow control valve to obtain the desired flows and measure the actual flows and the pressure drops. Use Table 1 as a guide. For each flow you can use the slope of the output from the volumetric detector to estimate the flow rate. After you have the flow set then you can log data to file. Table 1. Recommended measurements. Suggested flow rate (mL/s) actual flow (mL/s) ∆h (cm) 25 20 15 10 8 6 4 Report Before leaving the lab complete #2 below and show your results to the TA. Make sure you will be able to answer all of the questions below! Write a discussion and conclusion for the results of this experiment, incorporating answers to the following items. Include your raw data as an appendix. 1) Explain how you obtain the actual flow rate for each run from the output of the volumetric detector. 2) Create a graph showing the relationship between the orifice coefficient and Reynolds number. 3) Identify the major sources of error for this experiment and comment on which errors are potentially most significant. 4) The pressure sensor accuracy is approximately 1% of full scale. What is the flow rate that corresponds to 1% of the full-scale voltage? How does this affect your accuracy at a flow rate of 4 mL/s? 5) Calculate the velocity in the orifice at the highest flow rate achieved. Estimate the absolute pressure in the small orifice at the highest flow rate achieved. State your assumptions and show your work. Was the orifice in danger of cavitation? Hint: the pressure at the effluent is atmospheric!
