BAC-array based comparative genomic hybridization reveals
advertisement
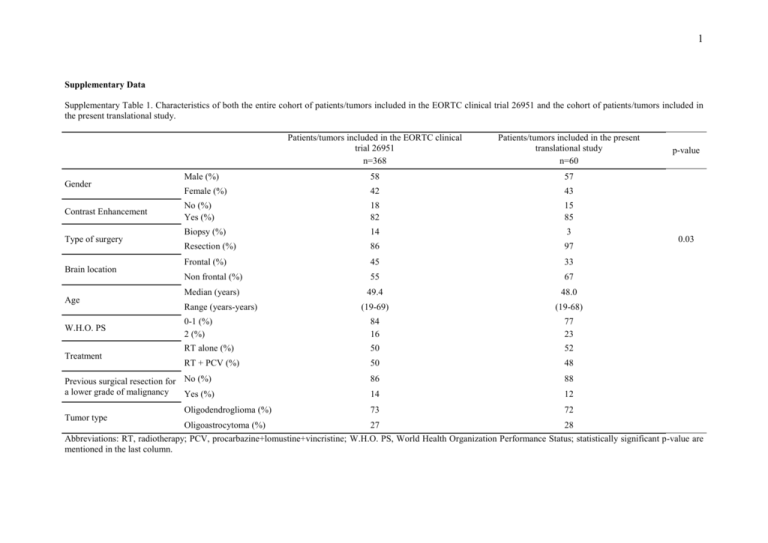
1 Supplementary Data Supplementary Table 1. Characteristics of both the entire cohort of patients/tumors included in the EORTC clinical trial 26951 and the cohort of patients/tumors included in the present translational study. Gender Contrast Enhancement Type of surgery Brain location Age W.H.O. PS Treatment Patients/tumors included in the EORTC clinical trial 26951 n=368 Patients/tumors included in the present translational study n=60 Male (%) 58 57 Female (%) 42 43 No (%) Yes (%) 18 82 15 85 Biopsy (%) 14 3 Resection (%) 86 97 Frontal (%) 45 33 Non frontal (%) 55 67 Median (years) 49.4 48.0 Range (years-years) (19-69) (19-68) 0-1 (%) 2 (%) 84 16 77 23 RT alone (%) 50 52 RT + PCV (%) 50 48 86 88 14 12 Oligodendroglioma (%) 73 72 Oligoastrocytoma (%) 27 28 Previous surgical resection for No (%) a lower grade of malignancy Yes (%) Tumor type p-value 0.03 Abbreviations: RT, radiotherapy; PCV, procarbazine+lomustine+vincristine; W.H.O. PS, World Health Organization Performance Status; statistically significant p-value are mentioned in the last column. 2 Supplementary Table 2. Characteristics of the cohort of patients/tumors from the clinical trial EORTC 26951 with a centrally reviewed-validated diagnosis of AOTs : (i) on the left column, patients/tumors without available frozen tissue and (ii) on the right column, patients/tumors with available frozen tissue allowing their inclusion in the present translational study. Patients/tumors without available frozen tissue Patients/tumors with available frozen tissue p-value n=212 n=45 Male (%) 59 60 Gender Female (%) 41 40 No (%) 17 16 Contrast Enhancement Yes (%) 83 84 Biopsy (%) 16 4 Type of surgery Resection (%) 84 96 Frontal (%) 48 29 Brain location p=0.03 Non frontal (%) 52 71 Median (years) 49.5 48.0 Age Range (years-years) 19-68 19-67 0-1 (%) 86 78 WHO PS 2 (%) 14 22 RT alone (%) 49 51 Treatment RT + PCV (%) 51 49 84 93 Previous surgical resection for No (%) a lower grade of malignancy Yes (%) 16 7 Oligodendroglioma (%) 68 73 Tumor type Oligoastrocytoma (%) 32 27 Abbreviations: RT, radiotherapy; PCV, procarbazine+lomustine+vincristine; W.H.O. PS, World Health Organization Performance Status; statistically significant p-value are mentioned in the last column. 3 Supplementary Table 3. The most frequently lost genomic regions in the entire population of anaplastic oligodendroglial tumors BAC name Chr Start End Gene(s) Frequency (%) DBACA1ZE09 9 14.0 14.2 NFIB 58.0 DBACA1ZG03 10 72.9 73.1 CDH23 57.6 ADELA11ZH09 9 21.7 21.9 MTAP 55.0 DBACA11ZB06 10 129.0 129.2 TACC2, BTBD16, PLEKHA1 55.0 ADELA8ZD01 10 129.4 129.6 DOCK1 55.0 APADA2ZE02 10 131.1 131.3 MGMT 55.0 DBACA11ZF04 10 128.8 129.0 DOCK1, FLJ45557 54.2 ADELA7ZE09 1 0.8 1.0 SAMD11, NOC2L, KLHL17, PLEKHN1, HES4, ISG15, AGRN, C1orf159 53.8 ADELA4ZE12 10 12.3 12.4 NUDT5, CDC123 53.3 ADELA9ZB01 9 21.9 22.0 MTAP, CDKN2A, CDKN2B 53.1 DBACA20ZC12 10 127.9 128.0 ADAM12 52.5 DBACA11ZD07 10 129.0 129.2 DOCK1 52.1 DBACA5ZG12 10 117.6 117.8 ATRNL1 51.7 DBACA11ZE03 10 124.8 125.0 ACADSB, HMX3, HMX2, BUB3 51.7 DBACA1ZC04 9 31.7 31.8 - 51.4 DBACA25ZC06 10 123.2 123.3 FGFR2 50.9 APADA1ZB10 10 39.0 39.2 - 50.9 DBACA3ZH07 10 91.4 91.6 MPHOSPH1 50.9 DBACA1ZG08 10 80.5 80.7 ZMIZ1 50.8 DBACA25ZD06 10 123.2 123.3 FGFR2 50.8 DBACA25ZB08 10 123.2 123.3 FGFR2 50.8 ADELA13ZD10 10 135.1 135.3 CYP2E1, SYCE1 50.8 ADELA7ZF09 1 8.5 8.7 RERE 50.0 DBACA14ZC01 1 26.8 27.0 ARID1A, PIGV, ZDHHC18 50.0 APADA3ZG01 10 87.5 87.7 GRID1 50.0 ADELA15ZC07 10 89.6 89.8 PTEN 50.0 DBACA11ZE04 10 105.3 105.5 SH3PXD2A 50.0 4 BPADA6ZD04 10 108.1 108.2 - 50.0 DBACA11ZG06 10 111.6 111.8 XPNEP1, ADD3 50.0 BPADA6ZE02 10 119.7 120.0 RAB11FIP2 50.0 ADELA15ZE07 10 123.1 123.2 FGFR2 50.0 APADA2ZC03 10 132.5 132.6 - 50.0 Abbreviations: Chr, chromosome; Start, BAC start in megabase; End, BAC end in megabase; -, no known gene. 5 Supplementary Table 4. The most frequently gained genomic regions in the entire population of anaplastic oligodendroglial tumors BAC name Chr Start End Genes Frequency (%) ADELA11ZC11 7 116.1 116.2 MET 55.0 DBACA26ZF11 7 86.1 86.2 GRM3 54.2 DBACA2ZB04 7 107.8 108.0 NRCAM, PNPLA8, THAP5, DNAJB9 54.2 DBACA23ZB04 7 115.8 116.0 CAV2 54.2 DBACA20ZD02 7 125.9 126.0 GRM8 54.2 DBACA1ZD05 7 157.1 157.3 PTPRN2 53.4 DBACA20ZG01 7 101.3 101.4 CUX1 53.3 DBACA5ZC07 7 102.3 102.5 FBXL13, LRRC17, ARMC10 53.3 DBACA20ZE01 7 105.0 105.2 - 53.3 APADA1ZE12 7 108.7 108.8 - 53.3 APADA1ZB11 7 110.7 110.9 IMMP2L 53.3 BPADA4ZG12 7 118.4 118.6 - 53.3 DBACA20ZE02 7 127.0 127.2 PAX4, SND1 53.3 APADA2ZE04 7 130.4 130.6 - 53.3 DBACA20ZH02 7 132.0 132.1 PLXNA4, CHCHD3 53.3 BPADA4ZE09 7 133.3 133.5 EXOC4, LRGUK 53.3 ADELA9ZA05 7 136.5 136.7 PTN 53.3 ADELA13ZF09 7 158.4 158.5 WDR60 53.3 DBACA26ZD11 7 86.1 86.2 GRM3 52.6 DBACA23ZB06 7 116.8 117.0 ASZ1, CFTR 52.6 DBACA5ZD08 7 103.3 103.5 RELN 52.5 BPADA4ZB08 7 106.3 106.5 PRKAR2B 52.5 BPADA5ZD06 7 135.0 135.1 NUP205, LOC402694, SLC13A4, UNQ1940 52.5 DBACA6ZH10 7 141.9 142.1 PRSS1 52.5 APADA2ZD04 7 112.1 112.3 TMEM168, FLJ31818 51.9 DBACA23ZD06 7 116.9 117.0 CFTR 51.7 ADELA13ZG01 7 131.5 131.6 PLXNA4 51.7 6 ADELA15ZF03 7 86.5 86.7 DMTF1, C7orf23 51.7 ADELA13ZD03 7 98.2 98.3 TMEM130 51.7 APADA2ZG05 7 109.8 110.0 - 51.7 APADA1ZH09 7 113.2 113.3 PPP1R3A 51.7 DBACA23ZC06 7 116.9 117.0 CFTR 51.7 DBACA20ZB03 7 150.4 150.5 ABCB8, ACCN3, CDK5, SLC4A2, FASTK, TMUB1, CENTG3, GBX1 51.7 BPADA5ZC05 7 154.3 154.5 DPP6, PAXIP1 51.7 DBACA20ZD01 7 93.1 93.3 - 50.9 DBACA7ZC06 7 123.3 123.5 SPAM1 50.9 ADELA13ZE03 7 150.3 150.4 KCNH2, NOS3, ATG9B, ABCB8, ACCN3, CDK5, SLC4A2, FASTK, TMUB1, CENTG3 50.9 DBACA20ZC01 7 94.1 94.3 SGCE, PEG10 50.8 APADA1ZE03 7 115.0 115.2 - 50.8 DBACA26ZE11 7 86.1 86.2 GRM3 50.0 APADA1ZD09 7 90.6 90.8 PFTK1, FZD1 50.0 DBACA24ZA05 7 91.9 92.0 ANKIB1, GATAD1, PEX1, DFKZP564O0523 50.0 DBACA1ZB07 7 120.2 120.4 TSPAN12, ING3 50.0 ADELA8ZF06 7 125.2 125.4 - 50.0 APADA2ZG02 7 129.2 129.3 NRF1, UBE2H 50.0 BPADA5ZF10 7 137.8 138.0 TRIM24, SVOPL 50.0 BPADA7ZD04 7 146.2 146.4 CNTNAP2 50.0 ADELA7ZB12 7 150.1 150.3 TMEM176B, ABP1, KCNH2, NOS3 50.0 BPADA7ZE06 7 155.8 156.0 - 50.0 Abbreviations: Chr, chromosome; Start, BAC start in megabase; End, BAC end in megabase; -, no known gene 7 Supplementary Table 5. Agreement between array aCGH and FISH investigations 1p/19 codeleted tumors by aCGH (n=13) EGFR amplified tumors by aCGH (n=15) 1p/19q codeleted by FISH 8 EGFR amplified by FISH 8 1p deleted/19q intact by FISH 2 Not EGFR amplified by FISH 1 1p intact/19q intact by FISH 1 EGFR locus not tested by FISH 6 1p/19q statuses not tested by FISH 2 Abbreviations: aCGH, BAC-array based comparative genomic hybridization; FISH, fluorescent in situ hybridization 8 Supplementary Table 6. Prognostic BACs used to build the genetic-prognostic tree Tree branch BAC name 1 BAC name 2 Chr Start End X Y Z Genes LFDR X1 ADELA15ZB03 7 55.0 55.2 EGFR 0.01 X2 DBACA23ZF10 7 55.0 55.1 EGFR 0.01 X3 BPADA5ZF07 7 55.3 55.5 LANCL2 0.01 X4 DBACA23ZE10 7 55.0 55.1 EGFR 0.01 Y1 ADELA12ZE06 1 46.5 46.6 C1orf190, RAD54L, LRRC41, UQCRH, NSUN4 0.01 Y2 DBACA2ZH06 1 106.7 106.8 - 0.02 Y3 DBACA3ZA01 1 86.7 86.8 CLCA2 0.03 Y4 DBACA23ZA07 1 47.3 47.4 CYP4Z1, CYP4A22 0.05 Y5 DBACA14ZE02 1 54.0 54.2 TMEM48, YIPF1, DIO1, C1orf41, LRRC42 0.05 Y6 DBACA13ZB11 1 42.1 42.3 HIVEP3 0.05 Y7 BPADA6ZF09 1 52.0 52.1 OSBPL9, NRD1 0.06 Y8 ADELA9ZA03 1 51.6 51.7 EPS15 0.10 Y9 DBACA14ZF02 1 101.3 101.4 DPH5 0.12 Y10 ADELA12ZE02 1 101.3 101.4 - 0.13 Y11 DBACA25ZC08 1 91.8 91.9 - 0.13 Y12 ADELA7ZD03 1 101.2 101.4 SLC30A7, DPH5 0.14 Y13 ADELA13ZC01 1 119.3 119.4 TBX15, WARS2 0.14 Y14 BPADA6ZD01 1 47.0 47.2 CYP4B1, CYP4A11 0.14 Y15 ADELA7ZG05 1 50.3 50.5 ELAVL4 0.14 Y16 ADELA13ZB01 1 101.0 101.1 EXTL2, SLC30A7 0.15 Z1 DBACA16ZG10 21 41.1 41.3 DSCAM 0.08 Z2 APADA2ZB06 21 32.3 32.4 HUNK 0.08 Z3 DBACA25ZB06 21 35.0 35.2 CLIC6, RUNX1 0.09 Z4 DBACA6ZA07 21 32.9 33.0 TCP10L, C21orf59, SYNJ1, C21orf66 0.10 Z5 DBACA26ZC07 21 33.2 33.3 OLIG2 0.10 Z6 DBACA24ZE05 21 39.0 39.1 ETS2 0.10 9 Z7 DBACA17ZA09 21 39.4 39.5 PSMG1, BRWD1 0.10 Z8 DBACA24ZD05 21 39.0 39.1 ETS2 0.11 Z9 DBACA6ZB08 21 36.3 36.5 SETD4, CBR1, CBR3, DOPEY2 0.12 Z10 DBACA6ZF07 21 31.9 32.1 TIAM, SOD1, SFRS15 0.12 Z11 DBACA6ZB07 21 45.6 45.8 COL18A1, C21orf123, COL18A1, SLC19A1 0.12 Z12 DBACA16ZD11 21 35.2 35.4 RUNX1 0.13 Z13 DBACA24ZH07 21 33.4 33.6 IFNAR2, IL10RB 0.15 Abbreviations: Chr, chromosome; Start, BAC start in megabase; End, BAC end in megabase; -, no known gene; LFDR, local false discovery rate Supplementary Table 7. Clinical, radiological and pathological characteristics of the entire population of anaplastic oligodendroglial tumors and the genetic-prognostic subgroups identified. N Number Sex Ratio (male/female) Age Median (year) Range (year-year) Entire population Type I Type II Type III Type IV 60 15 13 7 25 1.3 (34/26) 0.9 (7/8) 3.3 (10/3) 1.3 (4/3) 1.1 (13/12) 48.0 55.5 43.6 38.1 43.5 19.2-67.6 36.7-66.8 31.0-65.6 20.7-59 19.2-67.6 72/28 67/33 92/8 57.0/43.0 68/32 Oligodendroglioma/Oligoastrocytoma %/% High cellularity % 92 87 100.0 86 92 Presence of cytonuclear atypia % 92 87 100.0 86 92 Mitosis % 90 93 92 86 88 Endothelial abnormalities % 87 100 77 71 88 Necrosis % 63 93 46 71 52 Frontal location % 33 13 77 29 24 Contrast enhancement % 85 87 77 86 88 10 Supplementary Table 8. Univariate analysis and multivariate analysis in the entire population of anaplastic oligodendroglial tumors Univariate analysis Contrast enhancement Type of surgery Brain location Genomic type Age WHO performance status Treatment Necrosis Previous surgical resection for a lower grade glioma Endothelial abnormalities Tumor type n Median OS (years) no 9 1.2 yes 51 2.4 biopsy 2 1.2 resection 58 2.4 frontal 20 NR non frontal 40 1.6 II and IV 38 6.7 I and III 22 1.2 <48.0 29 6.7 >48.0 31 1.4 0-1 46 3.2 2 14 1.5 RT alone 31 1.5 RT + PCV 29 6.7 No 22 4.2 Yes 38 1.6 No 53 1.6 Yes 7 NR No 8 NR Yes 52 1.6 oligodendroglioma 43 2.5 p-value 0.002 <0.0001 <0.0001 0.006 0.002 0.04 0.02 HR (95%CI) Multivariate analysis p-value RR (95% CI) <0.0001 5.7 (2.8-11.9) 0.0002 3.8 (1.9-7.7) 0.30 (0.19-0.70) 0.22 (0.05-0.25) 0.28 (0.13-0.48) 2.47 (1.43-8.44) 0.37 (0.19-0.68) 0.49 (0.27-0.96) 7.57 (1.21-6.66) oligoastrocytoma 17 1.5 Abbreviations: WHO, world health organization; RT, radiotherapy; PCV, chemotherapy by procarbazine+lomustine+vincristione; NR, not reached; RR, relative risk; HR, hazard ration

