COMPARISON OF AREAS WITH CENSUS DATA
advertisement
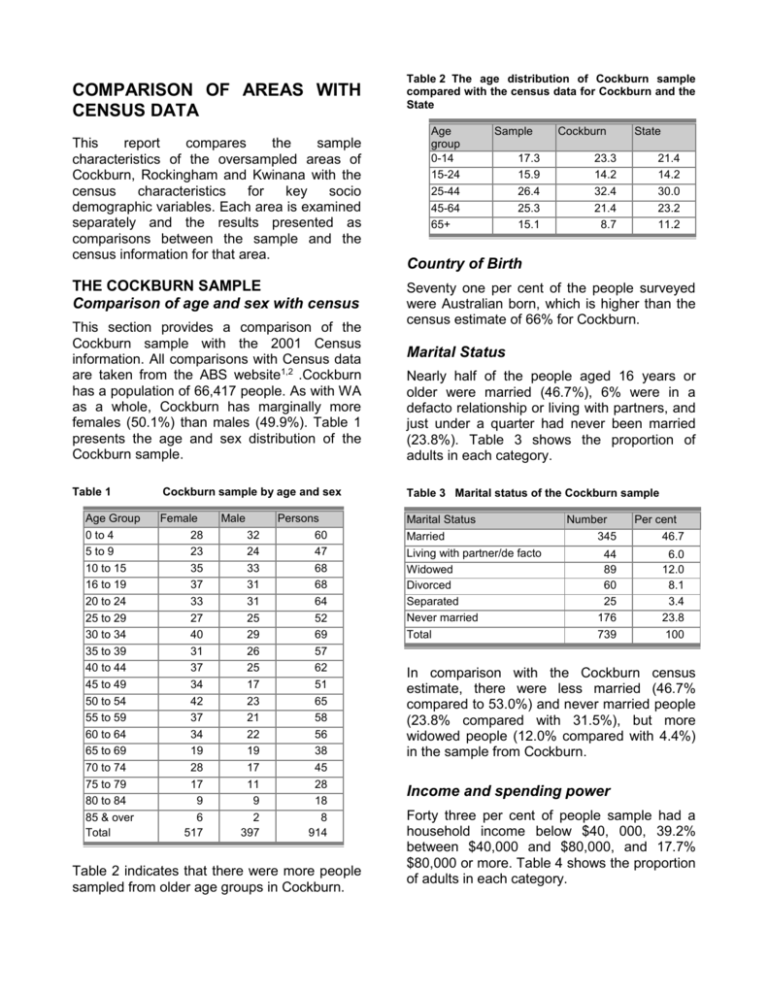
COMPARISON OF AREAS WITH CENSUS DATA This report compares the sample characteristics of the oversampled areas of Cockburn, Rockingham and Kwinana with the census characteristics for key socio demographic variables. Each area is examined separately and the results presented as comparisons between the sample and the census information for that area. THE COCKBURN SAMPLE Comparison of age and sex with census This section provides a comparison of the Cockburn sample with the 2001 Census information. All comparisons with Census data are taken from the ABS website1,2 .Cockburn has a population of 66,417 people. As with WA as a whole, Cockburn has marginally more females (50.1%) than males (49.9%). Table 1 presents the age and sex distribution of the Cockburn sample. Table 1 Age Group 0 to 4 5 to 9 10 to 15 16 to 19 20 to 24 25 to 29 30 to 34 35 to 39 40 to 44 45 to 49 50 to 54 55 to 59 60 to 64 65 to 69 70 to 74 75 to 79 80 to 84 85 & over Total Table 2 The age distribution of Cockburn sample compared with the census data for Cockburn and the State Age group 0-14 15-24 25-44 45-64 65+ Sample 17.3 15.9 26.4 25.3 15.1 Cockburn 23.3 14.2 32.4 21.4 8.7 State 21.4 14.2 30.0 23.2 11.2 Country of Birth Seventy one per cent of the people surveyed were Australian born, which is higher than the census estimate of 66% for Cockburn. Marital Status Nearly half of the people aged 16 years or older were married (46.7%), 6% were in a defacto relationship or living with partners, and just under a quarter had never been married (23.8%). Table 3 shows the proportion of adults in each category. Cockburn sample by age and sex Table 3 Marital status of the Cockburn sample Female 28 23 35 37 33 27 40 31 37 34 42 37 34 19 28 17 9 6 517 Marital Status Married Living with partner/de facto Widowed Divorced Separated Never married Total Male 32 24 33 31 31 25 29 26 25 17 23 21 22 19 17 11 9 2 397 Persons 60 47 68 68 64 52 69 57 62 51 65 58 56 38 45 28 18 8 914 Table 2 indicates that there were more people sampled from older age groups in Cockburn. Number 345 Per cent 46.7 44 89 60 25 176 739 6.0 12.0 8.1 3.4 23.8 100 In comparison with the Cockburn census estimate, there were less married (46.7% compared to 53.0%) and never married people (23.8% compared with 31.5%), but more widowed people (12.0% compared with 4.4%) in the sample from Cockburn. Income and spending power Forty three per cent of people sample had a household income below $40, 000, 39.2% between $40,000 and $80,000, and 17.7% $80,000 or more. Table 4 shows the proportion of adults in each category. In comparison with census data, there were similar proportions of people on less than $40,000 (43% compared to 44%), more people in the median range (39% compared to 29%), and fewer people on $80,000 or more (18% compared 27%). Table 4 The annual Cockburn sample Income range household Number income of the Employment status Almost three quarters of people aged 16 years or older were employed (71.2%) and 2.8% were unemployed. One quarter of the unemployed people (25.4%) were actively seeking employment. Table 6 presents the per cent of people in each category. A higher proportion of people reported being employed (71% compared to 61%) and less people were unemployed (3% compared 5%) compared with census estimates from Cockburn. Per cent Less than $20,000 170 18.8 $20,000 to $40,000 173 19.1 $40,000 to $60,000 170 18.8 $60,000 to $80,000 142 15.7 $80,000 to $100,000 82 9.1 Table 6 Employment status of the Cockburn sample Over $100,000 59 6.5 Refused 108 11.9 Total 904 100 Current employment Status Self-employed Employed for wages, Unemployed Engaged in home duties Retired Unable to work A student Other Total Twelve per cent of the Cockburn sample refused to answer the income question. The refusal rate was lower in Cockburn compared with the State (11.9% versus 16%). People were also asked about their overall spending power (Table 5). Number 46 345 23 75 40 21 49 3 602 Per cent 7.6 57.3 3.8 12.5 6.6 3.5 8.1 0.5 100 Table 5 Spending power of the Cockburn sample Spending power Number Per cent We are spending more money than we get 56 6.3 We have just enough money to get us through to the next pay 212 23.8 There is some money left over each week but we just spend it 70 7.9 We can save a bit every now and then 423 47.5 We can save a lot 129 14.5 Total 890 100 One quarter of the people had only just enough money each week, nearly half saved a little occasionally and 14.5% could save a lot. A small group (6.3%) said that they spent more money than they got. Education Table 7 presents the level of education reported by the Cockburn sample. Just over half of adults surveyed had completed at least Year 10 or Year 12 (53%). One quarter had completed a TAFE or Trade Certificate or Diploma and 16% had university qualifications. Table 7 Education sample level Highest level of education attained Some/Completed Primary School Completed Year 10 Completed Year 12 TAFE or Trade Certificate or Diploma Tertiary Other Total attained by Number Cockburn Per cent 30 169 140 5.3 29.7 24.6 153 92 15 569 26.9 16.2 2.6 100 The census data indicated that there was similar proportion of people with TAFE or Trade certification or Diploma (27% compared with 25%), though more people surveyed had tertiary qualifications (16% compared with 7%). The survey did not collect information on occupation or sector (industry) of employment, however the Cockburn census provides estimates on employment. The largest proportion of Cockburn residents were employed as intermediate clerical, sales or service workers (18.1%) and tradespersons (16%). Professionals (12.3%) and associate professionals (11.5%) were the next most common occupations, followed by labourers (10%). The Retail industry had the highest per cent of people employed (16.5%) followed by Manufacturing, (15.2%), Property and Business Services, (9.5%), Health and Community services (9.2%), Construction (8.1%) and Education (5.9%). Kwinana has a population of 20,812 people. Table eight presents the age and sex distribution of the Kwinana sample. Table 8 Kwinana sample by age and sex 0 to 4 5 to 9 10 to 15 16 to 19 20 to 24 25 to 29 30 to 34 35 to 39 40 to 44 45 to 49 50 to 54 55 to 59 60 to 64 65 to 69 70 to 74 75 to 79 80 to 84 85 & over Total Female 25 31 30 31 42 29 43 37 28 31 42 61 62 45 34 29 21 4 625 Male 24 22 40 31 27 22 22 29 28 27 27 48 33 41 25 7 6 3 462 Table 9 The age distribution of Kwinana sample compared with the census for Kwinana and the State Age group Sample 0-14 15-24 25-44 45-64 65+ Kwinana 20.0 9.6 31.1 27.4 11.9 25.2 13.7 31.4 20.7 9.0 State 21.4 14.2 30.0 23.2 11.2 Country of Birth Sixty one per cent of Kwinana people surveyed were Australian born, which is similar to the census estimate for Kwinana (66.4%). Marital Status THE KWINANA SAMPLE Age and Sex Age Group Table 9 indicates that the survey sampled less people from the 15-24 year age group and more from the oldest age group compared with Kwinana and the State census estimates1,3. Persons 49 53 70 62 69 51 65 66 56 58 69 109 95 86 59 36 27 7 1087 Just under half of the adults sampled were married (47.1%), 12.8% were divorced or separated people, 19.2% had never been married and 12.5% of people were widowed. Table 10 shows the proportion of adults in each category. In comparison with the census estimates, there were similar proportions of married (47.1% compared with 47.5%) and divorced or separated people (12.8% compared with 14.1%). However, there were less never married people (19.2% compared with 33.8%) and more widowed people (12.5% compared with 4%) the sample. Table 10 Marital status of the Kwinana sample Marital Status Number Married Living with partner/de facto Widowed a Per cent 430 47.1 77 8.4 114 12.5 Divorced 81 8.9 Separated 36 3.9 Never married 175 19.2 Total 913 100 Income and spending power Nearly two thirds of people surveyed from Kwinana had a income of less than $40,000 (62%), 29% earned $40,000 to $80,000 and 8.3% more than $80,000. Thirteen per cent of the Kwinana sample refused to answer the income question. The refusal rate was lower in Kwinana compared with the State (13% versus 16%).In comparison with the survey estimates there were similar proportions with an income of less than $40,000 (62% compared with 61%), more earned $40,000 to $80,000 (29% compared with 19%), and less people earning more than $80,000 (8.3% compared with 19%).Table 11 presents the annual household income for the Kwinana sample. Table 11 Annual Income for the Kwinana sample Income Level Number 277 25.5 $20,000 to $40,000 313 28.8 $40,000 to $60,000 179 16.5 $60,000 to $80,000 99 9.1 $80,000 to $100,000 47 4.3 Over $100,000 31 2.9 141 13.0 1087 100 Refused Total Employment status Two thirds of the people aged 16 years and older were employed. A further 3.3% were unemployed and of these, 66.7% were currently seeking employment. Table 13 shows the proportion of people in each category. Compared with the census estimates a higher proportion of people reported being employed (54% compared with 49%) and less were unemployed (3% compared with 7%). Table 13 The employment status of the Kwinana sample Current employment Status Self-employed Per cent Less than $20,000 save ‘a lot’ and 7% spent more money than they got Number 67 Employed for wages, salary or payment in kind Unemployed Engaged in home duties Retired Unable to work A student Other Total 309 34 113 62 47 54 13 699 Per cent 9.6 44.2 4.9 16.2 8.9 6.7 7.7 1.9 100 Educational Status Table 12 presents the spending power of people sampled in Kwinana. Table 12 Spending Power for the Kwinana sample Spending Power I am/we are spending more money than we get I/we have just enough money to get us through to the next pay There is some money left over each week but I/we just spend it I/we can save a bit every now and then I/we can save a lot Total Number Per cent 72 6.8 291 27.6 89 8.5 472 44.8 129 12.3 1053 100 Nearly half of the sample were able to save a little money occasionally (45%), 27% had just enough money each week, 12% were able to Nearly two thirds of people surveyed (61%) had completed Year 10 or Year 12. Another 30% of people had completed a TAFE or Trade certificate or Diploma and 5.6% had a tertiary qualification (Table 14). Table 14 Education level attained by the Kwinana sample Highest level of education attained Some/Completed Primary School Completed Year 10 Completed Year 12 TAFE or Trade Certificate or Diploma Tertiary Other Total Number Per cent 41 271 133 5.9 38.8 19.1 178 50 25 698 25.5 7.2 3.6 100 In comparison with the Kwinana census estimates, more people had completed a TAFE or Trade certificate or Diploma (census: 20.9%) and there was a higher proportion of people with tertiary qualifications (census: 3.4%). The survey did not collect information on occupation or sector (industry) of employment, however the Kwinana census provides estimates of the distribution of types and places of employment. The Manufacturing, (19.1%), had the highest per cent of people employed followed by Retail industry (17.2%) Property and Business Services (9%), Construction (8%) Health and Community Services (8%) and Education (4.2%). Most Kwinana residents were employed as Tradespersons and Related workers (18.3%) and Intermediate Clerical or Service workers (16.6%), followed by Labourers and Related workers (13.3%), Associate professionals (9.6%) and Professionals (7.6%). Table 16 indicates that the survey sampled less people from youngest and more older people compared with Rockingham and State census estimates 1,4. Table 16 The age distribution of the Rockingham sample compared with the census for Rockingham and the State Age group Sample 0-14 15-24 25-44 45-64 65+ Total Rockingham 17.8 14.3 21.5 28.0 18.4 100 State 25.1 13 29.4 20.9 11.6 100 21.4 14.2 30 23.2 11.2 100 Country of Birth Seventy per cent of the Rockingham were Australian born, which is the same as the Rockingham census estimate. Marital status ROCKINGHAM Age and Sex Rockingham has a population of 70,306 people. Table 15 presents the age and sex distribution of the Rockingham sample. Table 15 Rockingham sample by age and sex Age Group 0 to 4 yrs 5 to 9 yrs 10 to 15 yrs 16 to 19 yrs 20 to 24 yrs 25 to 29 yrs 30 to 34 yrs 35 to 39 yrs 40 to 44 yrs 45 to 49 yrs 50 to 54 yrs 55 to 59 yrs 60 to 64 yrs 65 to 69 yrs 70 to 74 yrs 75 to 79 yrs 80 to 84 yrs 85 & ove9r yrs Total Female 31 37 50 38 45 26 44 45 36 43 53 60 54 43 40 31 13 5 694 Male 37 41 47 45 34 23 28 24 40 32 36 38 30 33 28 29 5 1 551 Persons 68 78 97 83 79 49 72 69 76 75 89 98 84 76 68 60 18 6 1245 Just over half of the adults surveyed were married (53%) and 9.6% were divorced or separated. Only 19% had never been married and 12.4% were widowed. In comparison with the Rockingham census estimates, there was a similar proportion of married people (53% compared with 54.7%), and divorced or separated people (9.6% compared with 10.6%). However, there were less never married (census: 27.4%) and more widowed people in the sample (12.4% compared with 5.4%). Table 17 Marital status of the Rockingham sample Marital Status Married Living with a partner/de facto Widowed Divorced Separated Never married Total Number Per cent 531 53.0 61 6.1 124 12.4 61 6.1 35 3.5 190 19.0 1002 100 Income and spending power Table 18 presents the annual household income for the Rockingham sample. Table 18 The annual income of the Rockingham sample Annual Income Number Per cent less than $20,000 240 19.4 $20,000 to $40,000 268 21.7 $40,000 to $60,000 255 20.6 $60,000 to $80,000 177 14.4 $80,000 to $100,000 89 7.2 over $100,000 64 5.2 142 11.5 1236 100 Refused Total Just under half of people surveyed had an income of less than $40,000 (46.5%), 39.5% earned $40,000 to $80,000 and 14% more than $80,000. Twelve per cent of the Rockingham sample refused to answer the income question. The refusal rate was lower in Rockingham compared with the State (11.5% versus 16%). In comparison with census estimates, there were less people with an income of less than $40,000 (47% compared with 55%), more people with mid-range incomes (40% compared with 21%) and less with incomes over $80,000 per annum (14% compared with 24%). People from Rockingham were also asked about there overall spending power (Table 19). Table 19 Spending power of the Rockingham sample Spending Power Number Per cent I am/we are spending more money than we get 64 5.3 I/we have just enough money to get us through to the next pay There is some money left over each week but I/we just spend it I/we can save a bit every now and then I/we can save a lot Total 240 19.9 106 8.8 617 51.1 180 14.9 1207 100 The largest proportion of people were able to save a little money occasionally (51.1%); 20% had only just enough money each week, 15% could save ‘a lot’ and 5% spent more money than they got each week. Employment Status Seventy per cent of people were employed and only 3.2% unemployed. Most unemployed people (90%) said that they were currently looking for work. Census data indicated that a higher proportion of the sample was employed (70% compared with 49%) and less were unemployed (3% versus 7%) compared with the census estimates for Kwinana. Table 20 Employment status of the Rockingham sample Current employment Status Self-employed Employed for wages Unemployed Engaged in home duties Retired Unable to work A student Other Total Number 72 Per cent 9.3 422 25 105 72 30 44 3 773 54.6 3.2 13.6 9.3 3.9 5.7 0.4 100 Education Fifty six per cent of adults sampled had completed at least Year 10 or Year 12, 26% had completed a TAFE or Trade Certificate or Diploma and 12% had a Tertiary qualification (Table 21). Table 21 Education level attained by the Rockingham sample Highest level of education attained Some/Completed Primary School Completed Year 10 Completed Year 12 TAFE or Trade Certificate or Diploma Tertiary Other Total Number Per cent 29 235 185 3.8 30.6 24.1 203 89 27 768 26.4 11.6 3.5 100 The Rockingham census estimates indicated there were a similar proportions with a TAFE or Trade Certificate or Diploma (26% compared with 25.9%), but more people sampled had Tertiary qualifications (11.6% compared with 5.1%). The survey did not collect information on occupation or industry of employment, however the Rockingham census provides estimates on employment. Most Rockingham residents work as Tradespersons (18.6%) and Intermediate Clerical, Sales or Service workers (16.8%) followed by Associate professionals (12.3%), professionals (10.7%) and labourers (9.6%). The Retail industry (17%) and Manufacturing (17%), had the highest proportions of people employed followed by Health and Community Services (9%), Construction (8%), Property and Business Services (8%), and Education (6%). CONCLUSION The comparisons of the areas under study with the census data illustrates that the samples selected were reasonably representative of the areas in all these main socio demographics. The data will be adjusted to the age and sex distribution of the WA ERP for 2003 and weighted for oversampling which will correct for the main contributors to ill health. The samples can be validly used in a study comparing health status within the areas to the State.
