laboratory 748
advertisement

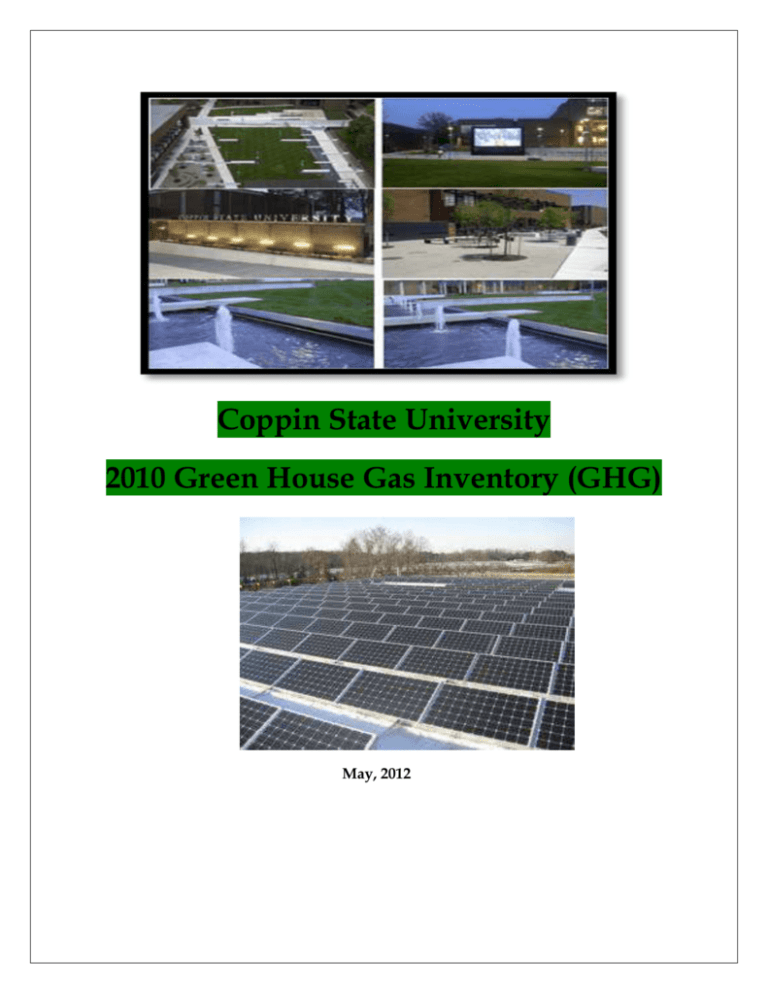
Coppin State University 2010 Green House Gas Inventory (GHG) May, 2012 Introduction As an active member of the ACUPCC (American College and University Presidents’ Climate Commitment) and AASHEE (Association for the Advancement of Sustainability in Higher Education), Coppin State University (CSU) is committed to reduce the emissions of greenhouse gases and to engage in activities that inform the campus and the surrounding community about the impact of global climate change. CSU is striving to achieve a high level of environmental stewardship and responsibility in the development and expansion of its campuses. Some instances of environmentally conscious projects include installing new energy efficient heating and cooling systems; installing solar panels on PEC (Physical Education Complex) building, efficient light fixtures, motion sensor lighting systems and installing ‘green tile’ which contains natural rock and recycled glass. In 2009, CSU did the first inventory of its GHG emissions and developed a 5 year climate action plan (http://rs.acupcc.org/site_media/uploads/cap/825-cap.pdf) based on its master development plan. The action plan identifies potential reduction and mitigation strategies between fiscal years 2010 and 2016. This report presents CSU’s 2010 Green house gas (GHG) emissions. In 2009, CSU emitted more than 16,271 metric tons of carbon dioxide equivalents. The vast majority of these emissions were from faculty and staff commuting as well as student commuting. Purchased electricity was the third largest contributor for greenhouse gas emissions. 2010 Campus Profile In 2010 the total student population at CSU was 3800, of which 3298 were undergraduates and 502 were graduate students. In contrast, in 2008, we had 4051 students in 2008 of which 3291 were undergraduates and 760 were graduate students. Table 1 presents the student population by level and status (starting from 1999). Compared to the 2008 (base year), the student population decreased by 6.1%. On the other hand, CSU had 826 employees (faculty and staff) compared to 748 in 2008 (base year). Table 2 presents the classification by year and gender. Compared to 2008 (base year), the employees population increase by 9.4%. Headcount of Faculty and Staff by Gender Year Men Women Total 2004 259 387 646 2005 260 372 632 2006 268 361 629 2007 277 420 697 2008 302 446 748 2009 336 452 788 2010 346 480 826 In terms of building infrastructure, CSU has 13 buildings comprising classrooms, laboratories, library, residence halls, dining facility, athletic and recreational facilities with a total area of 56 Acres. The newest building that became operational in 2010 was the Physical Education complex (PEC). This facility features classrooms, laboratories, auxiliary gyms, faculty/staff offices, dance studios, racquetball courts, weight training/fitness center, basketball arena, and swimming pool. It also contains a Satellite Central Utility Plant (SCUP), maintenance work shops, campus security operations, office areas, centralized mail and duplicating services, central receiving, vehicular maintenance, etc. As part of the sustainability initiative CSU installed a 500KW solar panels on this building. GHG Data Collection and Analysis Data were collected from various university units in accordance with ACUPCC guideline. The data includes energy consumption, employee and student commuting, university vehicle fleet. The units of metric tons of carbon dioxide equivalent (MTCO2e) are used in the inventory to account for the collective global warming potential of all six greenhouse gases including carbon dioxide (CO2), methane (CH4), nitrous oxide (N2O), Hydrofluorocarbons (HFCs), Perflurocarbons (PFCs) and Sulfur hexafluoride (SF6). GHG Emissions The Clean air-cool planet campus carbon calculator (CA-CP calculator version 6.7) was used to facilitate the collection, analysis and presentation of GHG emissions data. Scope 1 Emissions: Common Scope 1 emissions include on-campus electric generation, transportation, agriculture, fugitive emissions from air conditioning equipment. Since CSU doesn’t have on-campus electric generation (except for limited emergency back-up generation) and large agricultural farms we only considered transportation (University fleet) under this scope. CSU has 26 fleet vehicles that are owned and used for a number of activities, including but not limited to, police activities, student transportation and facilities maintenance. GHG emissions from fleet vehicles were calculated using the CA-CP calculator which requires fuel usage data. Assuming an annual average mileage of 6300 miles, the total amount of fuel consumed in FY2010 was 52,168 Gallons. The majority of vehicles use gasoline. There are no natural gas powered vehicles in the fleet. CSU has few electric vehicles (golf cars), but for purposes of estimating GHG emissions, the electricity used to charge the battery is accounted for as purchased electricity. Based on the CA-CP calculator, the GHG emission under this scope is 144 eCO2 (metric tons of CO2 equivalent). Compared to 2008 (base year), the increase is 16.6%. This is mainly due to the increased number of university vehicles (from 20 to 26). Scope 2 Emissions: the only scope 3 indirect emission source for CSU is purchase electricity. CSU doesn’t have other potential scope 2 emissions such as purchased steam or chilled water. CSU purchase electricity from direct energy and BGE to power air conditioning, lighting, computers, laboratory equipment, etc. GHG emissions associated with purchased electricity are calculated using the CA-CP calculator. Using the following equation: GHG emissions (Metric tons eCO2) = purchased electricity (KW-hrs) x Emissions factor (Metric tons eCO2/KW-hrs) For 2010, CSU’s purchased electricity was 21,460,669.00 KWh. The CA-CP calculator purchased electricity emission factors are based on the eGRID (emissions and generation resource Integrated Database) emission factors developed by US Environmental Protections Agency as part of the US greenhouse gas emission and sinks. The GHG emission under scope 2 is 8810.5 metric tons of eCO2. The increase in purchased electricity emissions is due to an increase in electricity consumption resulting from additions of more buildings. Scope 3 Emissions: the indirect emissions under this scope are primarily coming from faculty, staff and students commuting and solid waste disposal and subsequent GHG emissions from decomposition and contractor activities. The driving distance to CSU was based on the registered address for parking permit holders. For students the average distance was 18 miles and for faculty and staff the average is 25miles. Based on the CA-CP calculator, the emission under this scope was 15346.8 MTeCO2. This, compared to 2008, is a 32% increase which is mainly due to the increased number of employee (from 748 to 826) and more shuttle buses running around the campus and to the nearest metro station. Summary of Emission by Scope Table 4 presents a summary of emission by scope. As can be seen the total CSU emission for the fiscal year 2010 was 24301.2 MTeCO2. This is a 40% increase compared to the base year 2008. The increase can be accounted to the expansion of the university per the master development plan (more buildings, more employees…). Going forward, one big challenge is to commensurate the university’s expansion with GHG emissions. Table 1. 2010 eCO2 Emissions Breakdown Source eCO2 Emitted (Metric Tons) University Fleet 144.9 Purchased Electricity 8810.5 Employee Commuting 6,277.3 Student Commuting 8,942.1 Transportation Solid Waste Total 16.4 111.0 24301.2 The pie chart below clearly presents the percentage emission by scope. The highest emission (62%) comes from scope 3 (commuting) followed by scope 2 (purchased electricity 36%). In terms of reducing the carbon footprint much work need to be done on reducing the emissions coming from commuting both by students and employees. Recommendations and Next Steps • Since most GHG emissions are coming from Scope 3, we need to educate our students and employees about the alternative methods of commuting (car pooling, biking purchase of hybrid vehicles). • We need to tap more green energy sources instead of fully depending on the energy coming through the electric grid. • We need to develop templates/formats to accurately record the carbon sources and sinks. • More data needs to be collected to calculate those seemingly small emissions that are coming from the various scopes. References - Clean Air-Cool Planet Campus Carbon Calculator Excel Program and User guide, CA-CP Calculator, V 6.7. 2011 - Technical guidelines, voluntary reporting of Greenhouse gases 1605 (b) program, Office of Policy and International affairs, US DoE, 2006


