Homework 10
advertisement
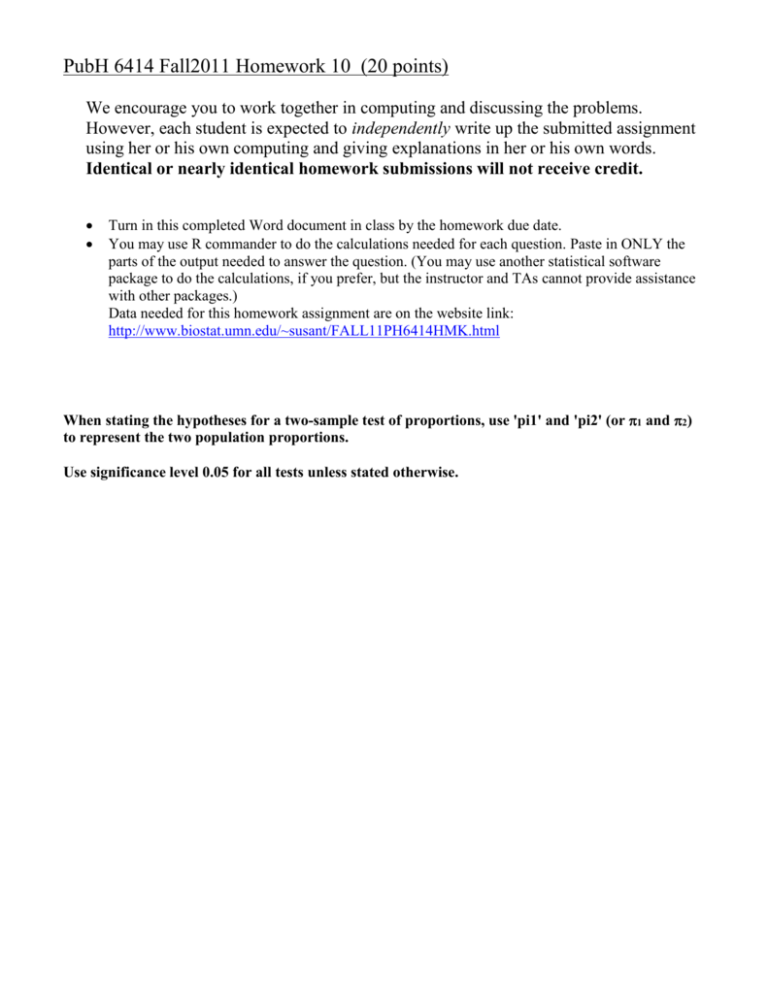
PubH 6414 Fall2011 Homework 10 (20 points) We encourage you to work together in computing and discussing the problems. However, each student is expected to independently write up the submitted assignment using her or his own computing and giving explanations in her or his own words. Identical or nearly identical homework submissions will not receive credit. Turn in this completed Word document in class by the homework due date. You may use R commander to do the calculations needed for each question. Paste in ONLY the parts of the output needed to answer the question. (You may use another statistical software package to do the calculations, if you prefer, but the instructor and TAs cannot provide assistance with other packages.) Data needed for this homework assignment are on the website link: http://www.biostat.umn.edu/~susant/FALL11PH6414HMK.html When stating the hypotheses for a two-sample test of proportions, use 'pi1' and 'pi2' (or 1 and 2) to represent the two population proportions. Use significance level 0.05 for all tests unless stated otherwise. Problem 1: Multiple Choice Questions. (3 points) A. Researchers are interested in the effect of air pollution due to traffic congestion on pulmonary function, measured as presence of wheezing. They could design a study in a number of different ways, as described below. For each proposed study below, name the most appropriate statistical test to use. In some cases, more than one test may be appropriate - you only need to name one of them. Choices: One-sample z-test Two-sample z-test Chi-square test Fisher’s exact test McNemar’s test 1) Measure the proportion of residents in a congested neighborhood who wheeze and compare to the national average level of wheezing. Test:_____________________. 2) Compare the proportion of residents whose wheezing improved from baseline to follow-up time in two neighborhoods: one with congested streets, and another where the congestion had recently been reduced by building a bypass. Test: _____________________. 3) Randomly sample residents in a congested neighborhood and measure the proportion who wheeze. Randomly sample the neighborhood again a year later, after a bypass reduced traffic congestion in their neighborhood, and measure the proportion who wheeze. Test: ______________________. 4) Randomly sample residents in a congested neighborhood and measure the proportion who wheeze. Follow up with the same residents a year later, after a bypass reduced traffic congestion in their neighborhood, and determine whether those residents still wheeze. Test: ______________________. 5) At a city clinic, find 100 people who are being treated for wheezing, and 200 people being treated for something not related to pulmonary function. Determine whether each person lives in a neighborhood with traffic congestion. Test: _______________________. 6) At a city clinic, find 100 people who are being treated for wheezing, and 100 age-, race- , SES- and gender-matched controls who are being treated for something not related to pulmonary function. Determine whether each person lives in a neighborhood with traffic congestion. Test: ____________. 7) At a city clinic, find 100 people who are being treated for wheezing, and 200 people being treated for something not related to pulmonary function. Determine whether each person lives in a neighborhood with traffic congestion. When the statistician begins to analyze the data, she finds that only 4 of the controls live in a congested neighborhood. Test: ______________________. B. In a two sample test of proportions, would the following items make it more likely or less likely that you would reject the null hypothesis? Choices: More likely to reject null. Less likely to reject null. It depends. A. Increasing the difference between the two proportions? ______________ B. Decreasing the size of one of the samples? _________________ C. Increasing the significance level of the test from alpha=0.05 to alpha = 0.10. _________________ D. Decreasing one of the two proportions. _____________________ E. Increasing the sizes of both samples. _________________ F. Increasing both proportions. ____________________ Problem 2: Milk Consumption in Children. (12 points) A cross-sectional survey study (Dennison study) was conducted to learn about nutritional behavior in children. Data on milk consumption are summarized in the table. Two-year-olds Five-year-olds Total Adequate Milk Consumption? Yes No 11 83 18 56 29 139 Total 94 74 168 Part A. Hypothesis test. Conduct a two-sample hypothesis test for a difference between the proportions with adequate milk consumption in two-year-olds relative to five-year-olds. Test for a difference in either direction with significance level 0.05. Your answer should include the following. For full credit, please show your work. 1. 2. 3. 4. 5. 6. 7. Your hypotheses (null and alternative) and whether the alternative is one- or two-sided. Is the normal approximation valid for both groups? Why or why not? The name of the appropriate test statistic. The critical value(s) for the test. The appropriate standard error (SE). The calculated test statistic and the p-value for the test. Your conclusions. (Do you reject your null hypothesis? Why or why not? If you reject it and conclude a difference exists, in which direction does the difference lie?) Part B. Confidence Interval. Construct a 95% confidence interval for the difference in proportions with adequate milk consumption in two-year-olds relative to five-year-olds. Your answer should include the following. For full credit, please show your work. 1. 2. 3. 4. 5. The appropriate standard error (SE). The appropriate confidence coefficient. The upper and lower confidence limits. The interpretation of the confidence interval. Does your calculated confidence interval include zero? What inference can you make from this observation? Part C. Contingency Table Test. Conduct a Chi-square test to compare the difference in proportions with adequate milk consumption in two-year-olds relative to five-year-olds. Use significance level 0.05 for the test. Your answer should include the following. For full credit, please show your work. 1. Your hypotheses (null and alternative) and whether the alternative is one- or two-sided. 2. The name of the appropriate test statistic. 3. 4. 5. 6. The critical value(s) for the test. The expected cell counts for each cell in the table. The calculated test statistic, the degrees of freedom, and the p-value for the test. Your conclusions. (Do you reject your null hypothesis? Why or why not? If you reject it and conclude a difference exists, in which direction does the difference lie?) Part D. Compare the conclusions from Parts A, B and C. Do they agree? Is the chi-square statistic in Part C equal to the square of the z-statistic in Part A? (If not, recheck your calculations.) Problem 4: Estrogen and Endometrial Cancer (5 points) The table below shows data for a matched pairs case-control study on endometrial cancer. The exposure is ‘ever having taken any estrogen supplements’. Cases: Exposed Unexposed Matching Controls: Exposed Unexposed 27 29 3 4 Use the McNemar Chi-square test to test for equality of proportion exposed to estrogen between controls (no cancer) and cases (cancer). To phrase it differently, among matched pairs where there is a difference in exposure for cases and controls, test whether the proportion of cases exposed to estrogen is the same as the proportion of controls exposed to estrogen. Your answer should include the following. For full credit, please show your work. 1. 2. 3. 4. Your hypotheses (null and alternative) and whether the alternative is one- or two-sided. The name of the appropriate test statistic. The critical value(s) for the test. Highlight the discordant cells in the table (where there is a difference in exposure for cases and controls). 5. The calculated test statistic, the degrees of freedom, and the p-value for the test. 6. Your conclusions. (Do you reject your null hypothesis? Why or why not? If you reject it and conclude a difference exists, in which direction does the difference lie?)

