Supplementary material 1
advertisement
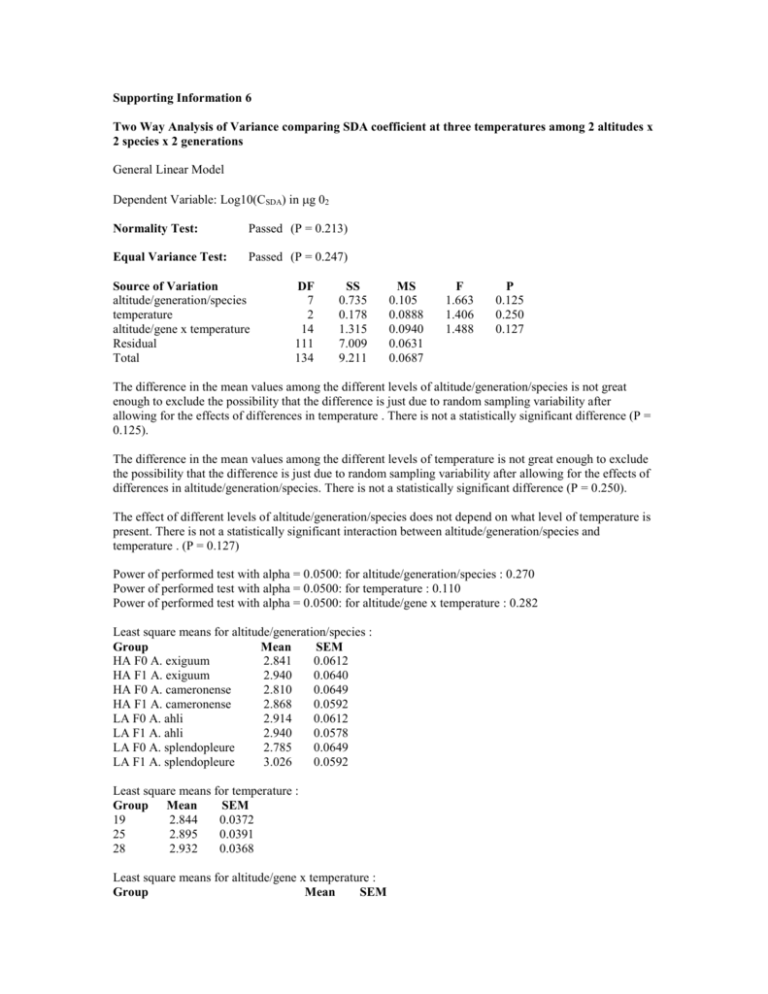
Supporting Information 6 Two Way Analysis of Variance comparing SDA coefficient at three temperatures among 2 altitudes x 2 species x 2 generations General Linear Model Dependent Variable: Log10(CSDA) in g 02 Normality Test: Passed (P = 0.213) Equal Variance Test: Passed (P = 0.247) Source of Variation altitude/generation/species temperature altitude/gene x temperature Residual Total DF 7 2 14 111 134 SS 0.735 0.178 1.315 7.009 9.211 MS 0.105 0.0888 0.0940 0.0631 0.0687 F 1.663 1.406 1.488 P 0.125 0.250 0.127 The difference in the mean values among the different levels of altitude/generation/species is not great enough to exclude the possibility that the difference is just due to random sampling variability after allowing for the effects of differences in temperature . There is not a statistically significant difference (P = 0.125). The difference in the mean values among the different levels of temperature is not great enough to exclude the possibility that the difference is just due to random sampling variability after allowing for the effects of differences in altitude/generation/species. There is not a statistically significant difference (P = 0.250). The effect of different levels of altitude/generation/species does not depend on what level of temperature is present. There is not a statistically significant interaction between altitude/generation/species and temperature . (P = 0.127) Power of performed test with alpha = 0.0500: for altitude/generation/species : 0.270 Power of performed test with alpha = 0.0500: for temperature : 0.110 Power of performed test with alpha = 0.0500: for altitude/gene x temperature : 0.282 Least square means for altitude/generation/species : Group Mean SEM HA F0 A. exiguum 2.841 0.0612 HA F1 A. exiguum 2.940 0.0640 HA F0 A. cameronense 2.810 0.0649 HA F1 A. cameronense 2.868 0.0592 LA F0 A. ahli 2.914 0.0612 LA F1 A. ahli 2.940 0.0578 LA F0 A. splendopleure 2.785 0.0649 LA F1 A. splendopleure 3.026 0.0592 Least square means for temperature : Group Mean SEM 19 2.844 0.0372 25 2.895 0.0391 28 2.932 0.0368 Least square means for altitude/gene x temperature : Group Mean SEM HA F0 A. exiguum x 19 HA F0 A. exiguum x 25 HA F0 A. exiguum x 28 HA F1 A. exiguum x 19 HA F1 A. exiguum x 25 HA F1 A. exiguum x 28 HA F0 A. cameronense x 19 HA F0 A. cameronense x 25 HA F0 A. cameronense x 28 HA F1 A. cameronense x 19 HA F1 A. cameronense x 25 HA F1 A. cameronense x 28 LA F0 A. ahli x 19 LA F0 A. ahli x 25 LA F0 A. ahli x 28 LA F1 A. ahli x 19 LA F1 A. ahli x 25 LA F1 A. ahli x 28 LA F0 A. sple x 19 LA F0 A. sple x 25 LA F0 A. sple x 28 LA F1 A. sple x 19 LA F1 A. sple x 25 LA F1 A. sple x 28 2.787 2.690 3.046 2.832 2.933 3.054 2.778 2.931 2.722 2.676 2.888 3.042 2.898 3.018 2.827 2.920 3.048 2.852 2.739 2.713 2.902 3.126 2.941 3.010 0.103 0.112 0.103 0.103 0.126 0.103 0.112 0.112 0.112 0.103 0.103 0.103 0.103 0.112 0.103 0.103 0.103 0.0950 0.112 0.112 0.112 0.103 0.103 0.103
