Transportation Practice Case
advertisement
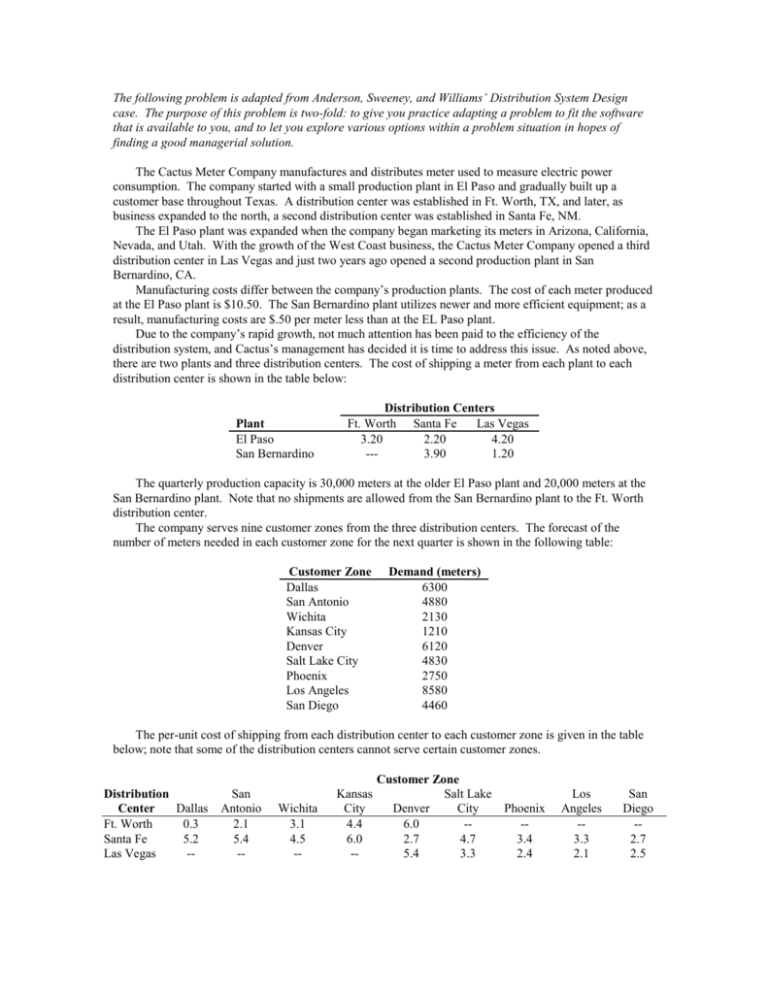
The following problem is adapted from Anderson, Sweeney, and Williams’ Distribution System Design case. The purpose of this problem is two-fold: to give you practice adapting a problem to fit the software that is available to you, and to let you explore various options within a problem situation in hopes of finding a good managerial solution. The Cactus Meter Company manufactures and distributes meter used to measure electric power consumption. The company started with a small production plant in El Paso and gradually built up a customer base throughout Texas. A distribution center was established in Ft. Worth, TX, and later, as business expanded to the north, a second distribution center was established in Santa Fe, NM. The El Paso plant was expanded when the company began marketing its meters in Arizona, California, Nevada, and Utah. With the growth of the West Coast business, the Cactus Meter Company opened a third distribution center in Las Vegas and just two years ago opened a second production plant in San Bernardino, CA. Manufacturing costs differ between the company’s production plants. The cost of each meter produced at the El Paso plant is $10.50. The San Bernardino plant utilizes newer and more efficient equipment; as a result, manufacturing costs are $.50 per meter less than at the EL Paso plant. Due to the company’s rapid growth, not much attention has been paid to the efficiency of the distribution system, and Cactus’s management has decided it is time to address this issue. As noted above, there are two plants and three distribution centers. The cost of shipping a meter from each plant to each distribution center is shown in the table below: Plant El Paso San Bernardino Distribution Centers Ft. Worth Santa Fe Las Vegas 3.20 2.20 4.20 --3.90 1.20 The quarterly production capacity is 30,000 meters at the older El Paso plant and 20,000 meters at the San Bernardino plant. Note that no shipments are allowed from the San Bernardino plant to the Ft. Worth distribution center. The company serves nine customer zones from the three distribution centers. The forecast of the number of meters needed in each customer zone for the next quarter is shown in the following table: Customer Zone Dallas San Antonio Wichita Kansas City Denver Salt Lake City Phoenix Los Angeles San Diego Demand (meters) 6300 4880 2130 1210 6120 4830 2750 8580 4460 The per-unit cost of shipping from each distribution center to each customer zone is given in the table below; note that some of the distribution centers cannot serve certain customer zones. Distribution Center Dallas Ft. Worth 0.3 Santa Fe 5.2 Las Vegas -- San Antonio 2.1 5.4 -- Wichita 3.1 4.5 -- Kansas City 4.4 6.0 -- Customer Zone Salt Lake Denver City 6.0 -2.7 4.7 5.4 3.3 Phoenix -3.4 2.4 Los Angeles -3.3 2.1 San Diego -2.7 2.5 In the current distribution system, demand at the Dallas, San Antonio, Wichita, and Kansas City customer zones is satisfied by shipments from the Ft. Worth distribution center. In a similar manner, the Denver, Salt Lake City, and Phoenix customer zones are served by the Santa Fe distribution center, and the Los Angeles and San Diego customer zones are served by the Las Vegas distribution center. To determine how many units to ship from each plant, the quarterly demand forecasts are aggregated at the distribution centers, and a transportation model is used to minimize the cost of shipping from the production plants to the customer zones. This means the model is solved once for each distribution center. The company is now more concerned about transportation costs and wants to use a more complex model, so that is no longer possible. Instructions: Solve the problem in one stage, treating the production plants and distribution centers as pairs (i.e., El Paso - Ft. Worth, El Paso - Santa Fe, El Paso - Las Vegas, San Bernardino - Ft. Worth, San Bernardino - Santa Fe, San Bernardino - Las Vegas). To keep from limiting what the computer can do, you will have to allow each route full production capacity. Three strategies have been proposed for you to analyze: leaving the current distribution strategy (first paragraph, this page) as is, changing the current strategy to allow shipping on all geographically feasible routes (e.g. – routes that have a cost assigned, but that are not used in the first run), and allowing direct shipping on some routes (San Bernardino to Los Angeles, $.30/unit, San Bernardino to San Diego, $.70/unit, and El Paso to San Antonio, $3.50/unit) where shipping appears to be unnecessarily long. The transportation model solution will give you the changes in routes used and total transportation cost for each strategy, but you are also to consider how these changes may affect the company beyond changes in the transportation cost. Also, study the computer output to see if you can make any suggestions based on the results. Based on the solution using direct shipping (the thirds strategy mentioned above) answer the following questions. Treat each question independently of the others. 1) Cactus Meter Company is considering an upgrade of their existing production equipment. If they go ahead with this, it will cause a decrease in capacity of 6,000 units for each plant during the next quarter while the upgrade shuts down various parts of the production line. Your boss wants to know what effects this will have on the ability to deliver products to the customers and the cost of doing so. 2) Cactus Meter Company is anticipating moving into the Pacific Northwest (northern California, Oregon, and Washington), with a forecast quarterly demand of around 4,000 meters and where a competing electric meter currently sells for $22.00. Make a recommendation on whether or not the company should consider adding this customer zone and whether they need to expand the capacity of the San Bernardino plant as a result of adding the PNW customer zone.

